MULTICAL® 403
Kamstrup A/S · Technical description · FILE100000166_B_EN-55121689_M1_07.2023
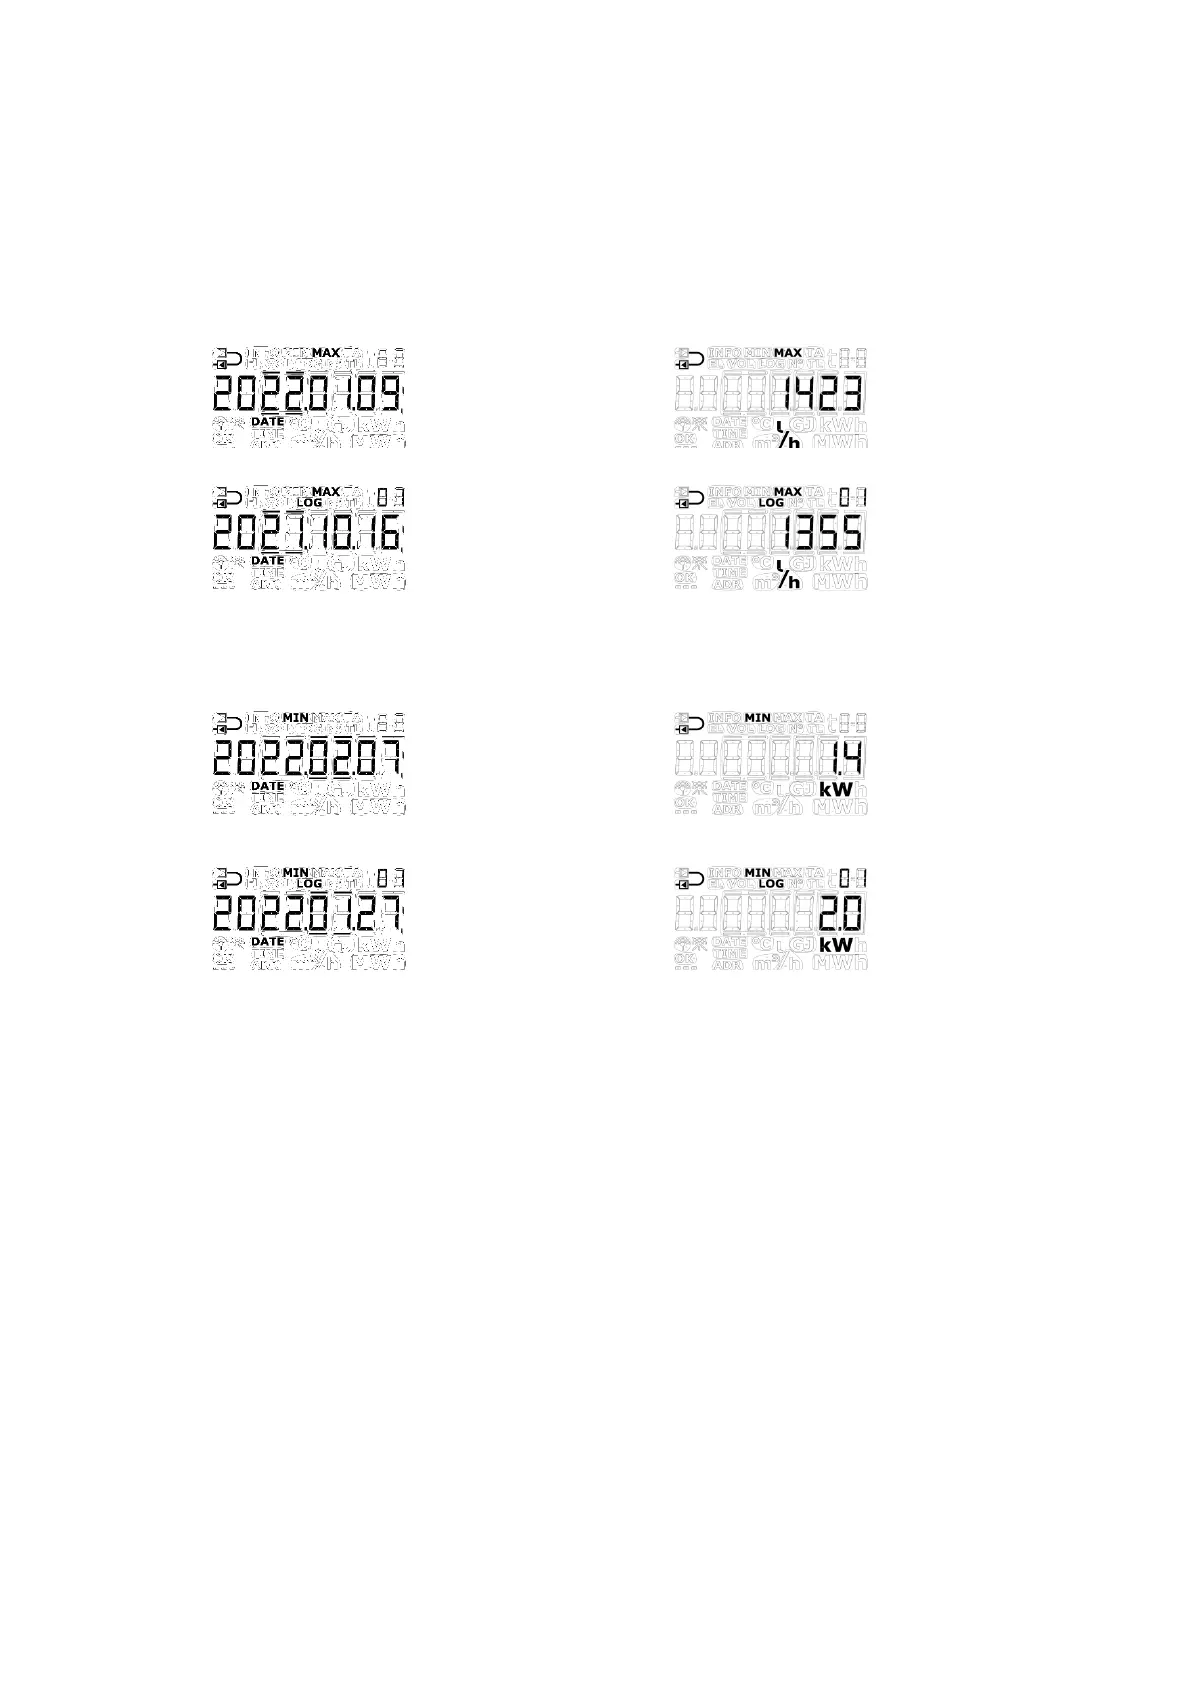
Below you see examples of display readings of the date and data readings. The frames around the date indicate
whether the date is connected to yearly or monthly data. In data readings of yearly data the last two digits of the
year are marked in frames, whereas the two digits for month are marked for monthly data. Furthermore, the
symbols ”MIN” and ”MAX” are shown to indicate whether the values are minimum or maximum values. The symbol
”LOG” is shown for historical readings.
Examples of yearly date and data (max. values) for flow
Date of max. yearly logger
Data of max. yearly logger
Examples of monthly date and data (min. values) for power
Date of min. monthly logger
Data of min. monthly logger
All minimum and maximum values are calculated as the average of a number of current flow or power
measurements. After each averaging period the latest value is compared to previous values, and the new value is
saved as maximum or minimum if it exceeds the previous maximum value or is lower than the previous minimum
value. The averaging period used for all calculations can be selected in the interval 1...1440 min. in leaps of one
minute. (1440 min. = 24 hours). The averaging period and the target dates are stated in the order. Read more about
order data in paragraph 3.3. If not otherwise stated in the order, the default averaging period of 60 min. is used. This
value can later be changed via ”SETUP loop” or via METERTOOL HCW.
Please note the following:
• In the display the date is shown in the format 20YY.MM.DD, but by serial reading the time can be stated too,
and the format then becomes YY.MM.DD, hh.mm.ss.
• The averaging period starts the moment the meter is powered, i.e. when the battery is mounted in the
meter or when mains supply is switched on. Therefore, the averaging period is not necessarily synchronous
with the change of day. Due to this fact the min./max. calculation is immune to the clock setting as the
interval is kept intact at e.g. 60 or 1440 min.