K990400 16 April 2008
Detail Screens
8-13
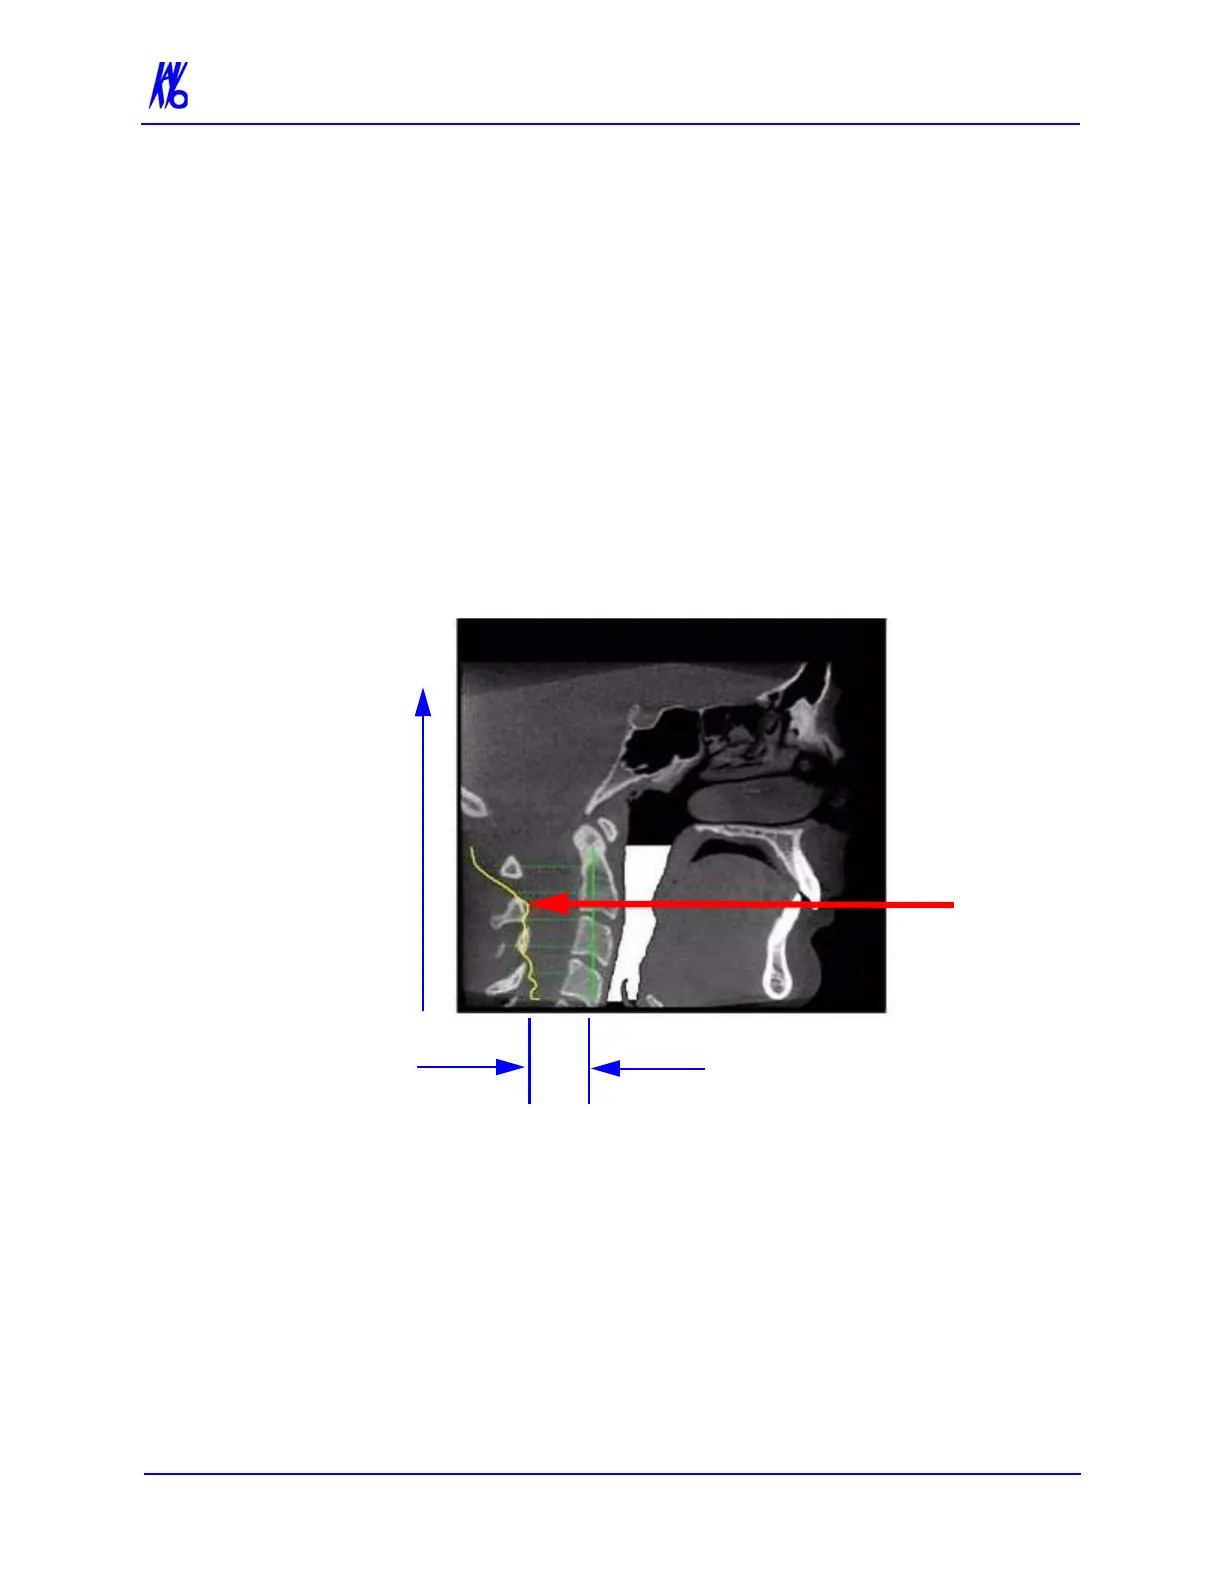
In the example below, the plot shows the opening of the airway
along the vertical axis of the graph. The green vertical line is the zero
line in the graph. The yellow curve shows the 3D width of the airway
along the Z direction of the volume and is proportional to the 3D
airway voxel volume in each corresponding axial slice. The red line
passes through an area in the airway which is narrower relative to the
surrounding area. This is depicted by a dip in the yellow curve
toward the green vertical zero line of the graph.
Since a constriction could be present in the depth of the image, a
single image may not be sufficient to assess airway volume.
However, the curve is accurate since it is created from the airway
volume contained in each slice along the Z direction. The amplitude
at every point in the yellow curve is a true 3D representation of the
airway volume at the corresponding axial slice location.
To remove the airway information from the View, right click the
airway view and select Untag Airways.
If Tag Airways is reselected after certain image manipulations have
occurred, a dialog is displayed. Click OK in the dialog, then in the
Mid Sagittal image, click the airway below the flap. The airway tag
is displayed.