134
3.18 Inter-Plate Consistency
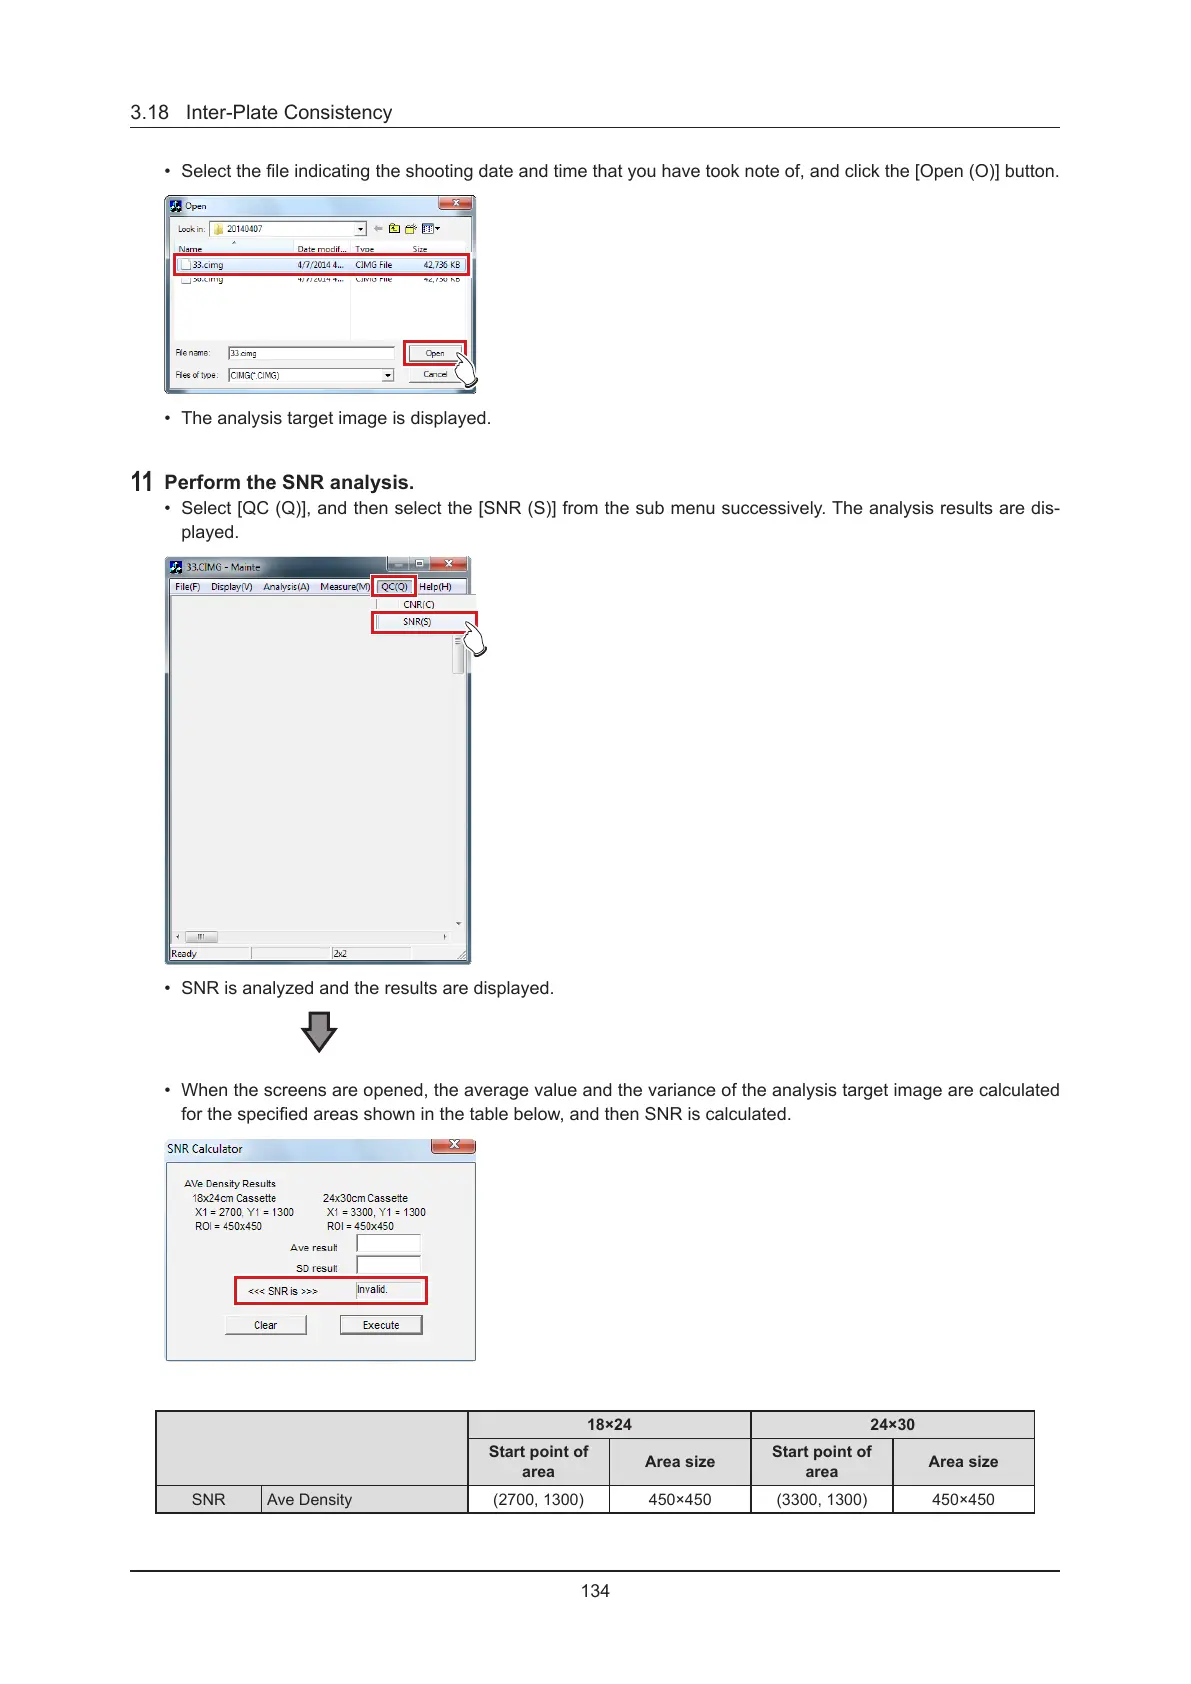
• Select the le indicating the shooting date and time that you have took note of, and click the [Open (O)] button.
• The analysis target image is displayed.
11
Perform the SNR analysis.
• Select [QC (Q)], and then select the [SNR (S)] from the sub menu successively. The analysis results are dis-
played.
• SNR is analyzed and the results are displayed.
• When the screens are opened, the average value and the variance of the analysis target image are calculated
for the specied areas shown in the table below, and then SNR is calculated.
18×24 24×30
Start point of
area
Area size
Start point of
area
Area size
SNR Ave Density (2700, 1300) 450×450 (3300, 1300) 450×450
 Loading...