The Display Control knobs provide vertical expansion (up to 10 times)
and vertical position control.
To read the amplitude and frequency of the data point, the Marker can
be moved over into the frequency domain by going beyond the right hand
edge of the time domain waveform.
The Time Cursors can be moved beyond the right hand edge of the time
domain waveform and thus become Frequency Cursors, providing
simultaneous readout of frequency difference and of amplitude
difference between two points on each frequency domain trace.
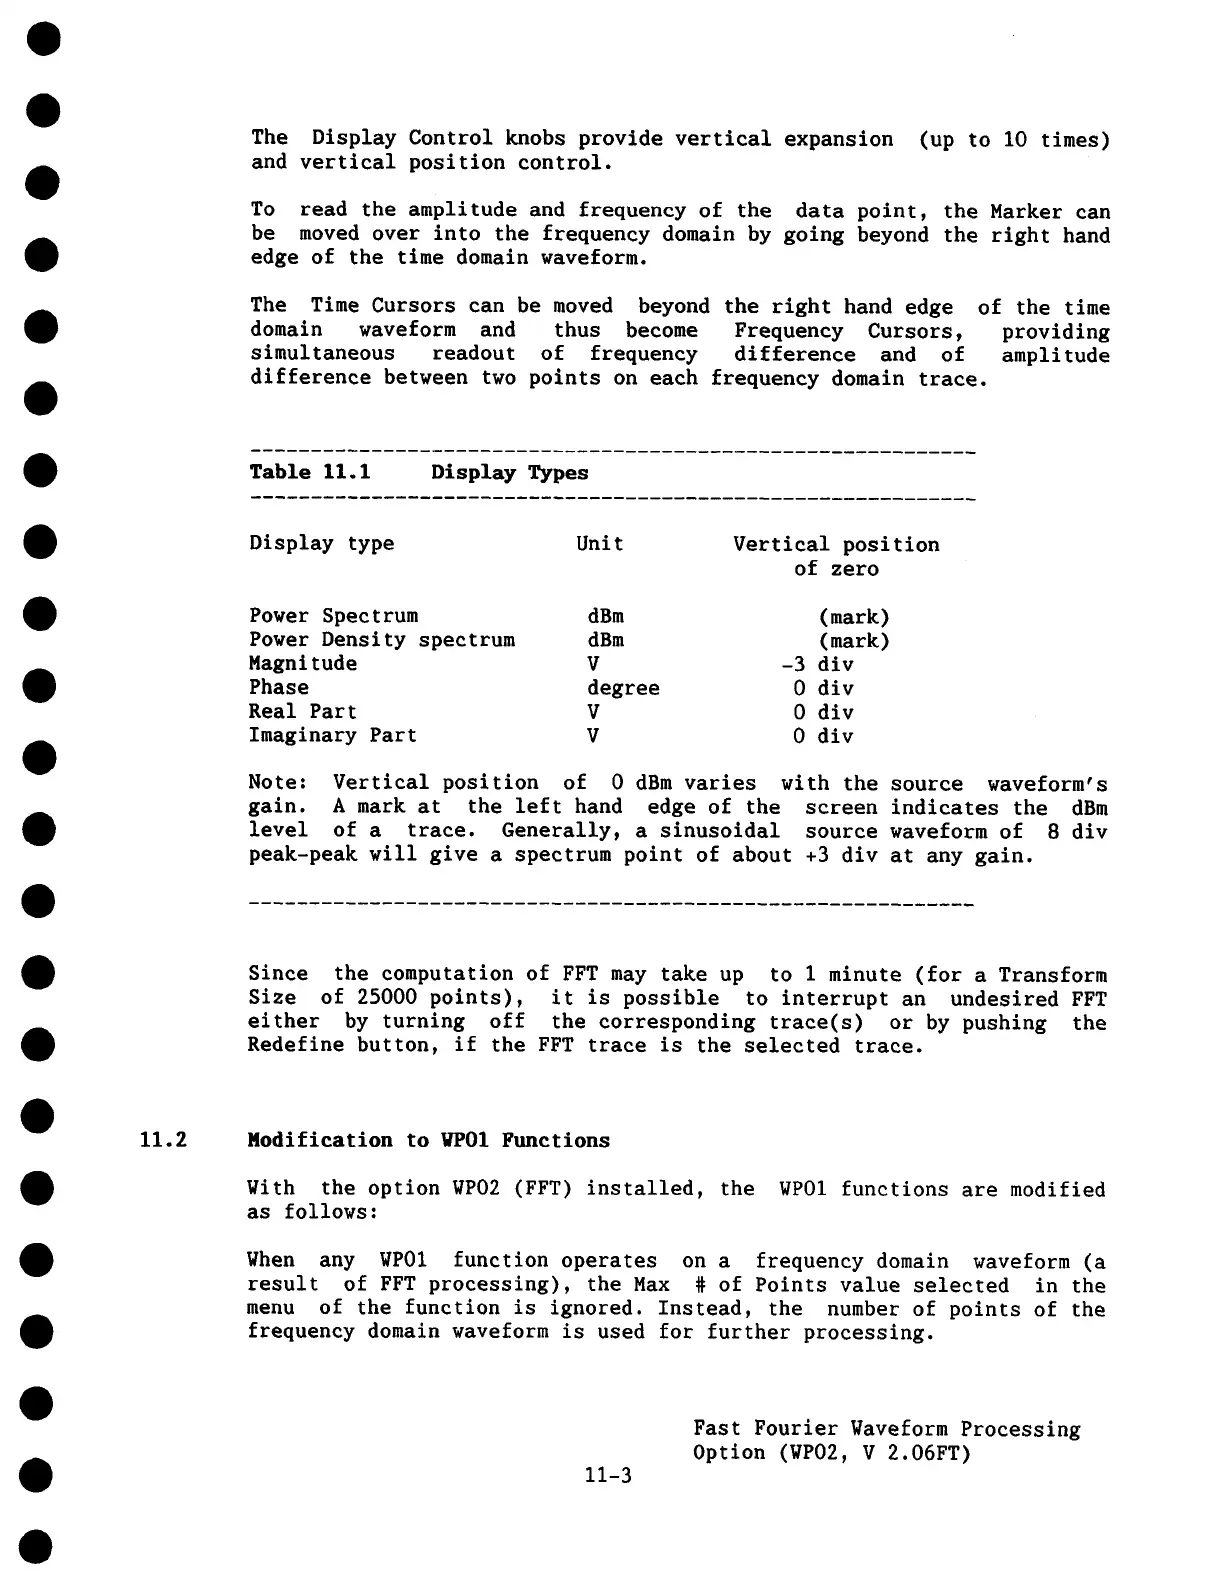
Table 11.1 Display Types
Display type Unit Vertical position
of zero
Power Spectrum
dBm (mark)
Power Density spectrum dBm
(mark)
Magnitude
V -3 div
Phase degree
0 div
Real Part
V 0 div
Imaginary Part V
0 div
Note:
Vertical position of 0 dBm varies with the source waveform’s
gain.
A mark at the left hand edge of the screen indicates the dBm
level of a trace. Generally, a sinusoidal source waveform of 8 div
peak-peak will give a spectrum point of about +3 div at any gain.
Since the computation of FFT may take up to 1 minute (for a Transform
Size of 25000 points), it is possible to interrupt an undesired FFT
either by turning off the corresponding trace(s) or by pushing the
Redefine button, if the FFT trace is the selected trace.
11.2 Modification to WPO1 Functions
With the option WP02 (FFT) installed, the WP01 functions are modified
as follows:
When any WP01 function operates on a frequency domain waveform (a
result of FFT processing), the Max # of Points value selected in the
menu of the function is ignored. Instead, the number of points of the
frequency domain waveform is used for further processing.
11-3
Fast Fourier Waveform Processing
Option (WP02, V 2.06FT)
 Loading...
