32 iGrowSeries 100 Installation Manual 960-0001-20
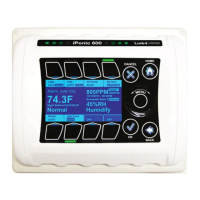
This section allows the user to view the historical data collected by
the controller in a graphical manner.
Pressing Button #2 from Reports submenu will take the user to
graphing submenu.
The graphs for the following sensors can be seen:
Temperature
Humidity
Light
CO2
To highlight the sub options Wheel or Buttons #1 - #4 can be
used to go to the corresponding options. Pressing OK will let user
select the options
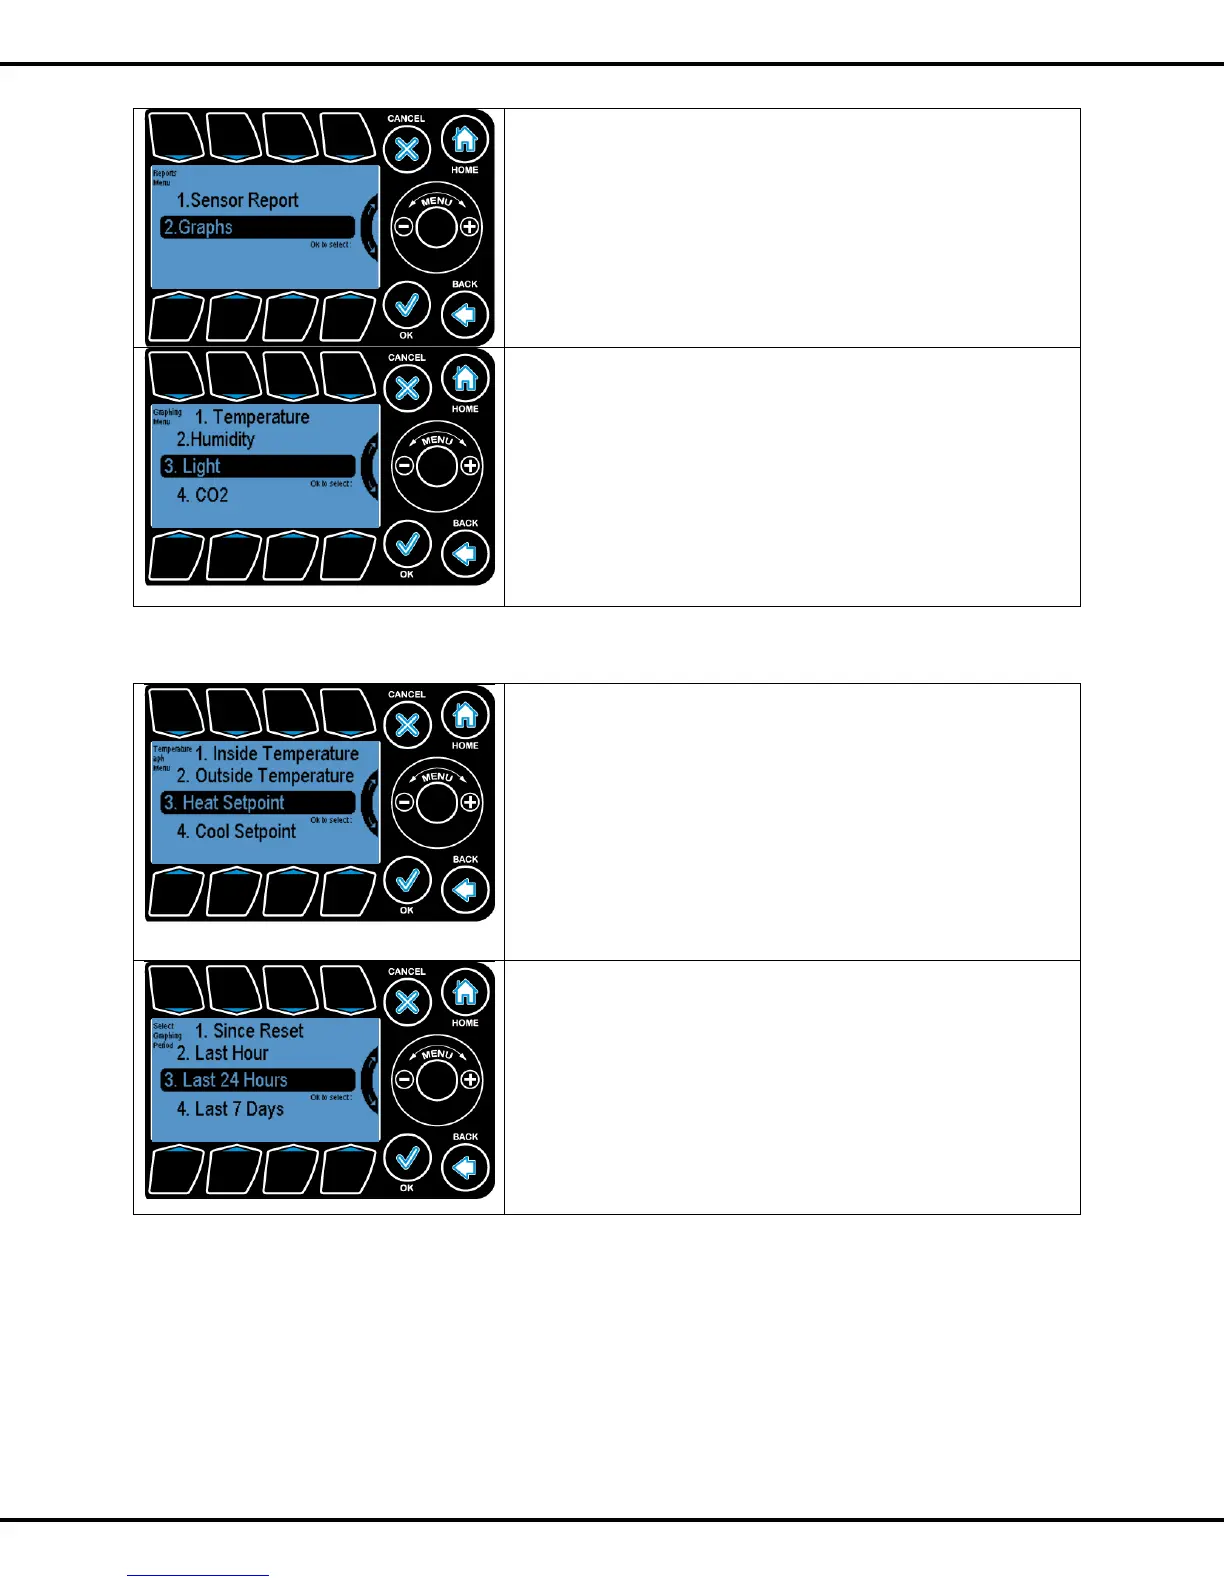
3.2.1 Temperature
In the temperature option user can view graphs for the following
• Inside Temperature
• Outside Temperature
• Heat Setpoint
• Cool Setpoint
To highlight the sub options Wheel or Buttons #1 - #4 can be
used to go to the corresponding options. Pressing OK will let user
select the options
User can view the graphs for the following time periods
• Since Reset
• Last Hour
• Last 24 hour
• Last 7 days
To highlight the sub options Wheel or Buttons #1 - #4 can be used
to go to the corresponding options. Pressing OK will let user can view
the graphs.