960-0001-20 iGrowSeries 100 Installation and User Manual 33
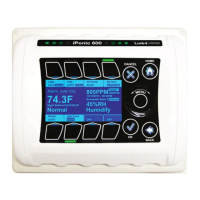
3.2.2 Humidity
In the humidity option user can view graphs for the following
• Inside Humidity
• Humidity Setpoint
• Dehumidify Setpoint
To highlight the sub options Wheel or Buttons #1 - #3 can be used
to go to the corresponding options. Pressing OK will let user select
the options. Similar to temperature option user can view graphs for
different time periods.
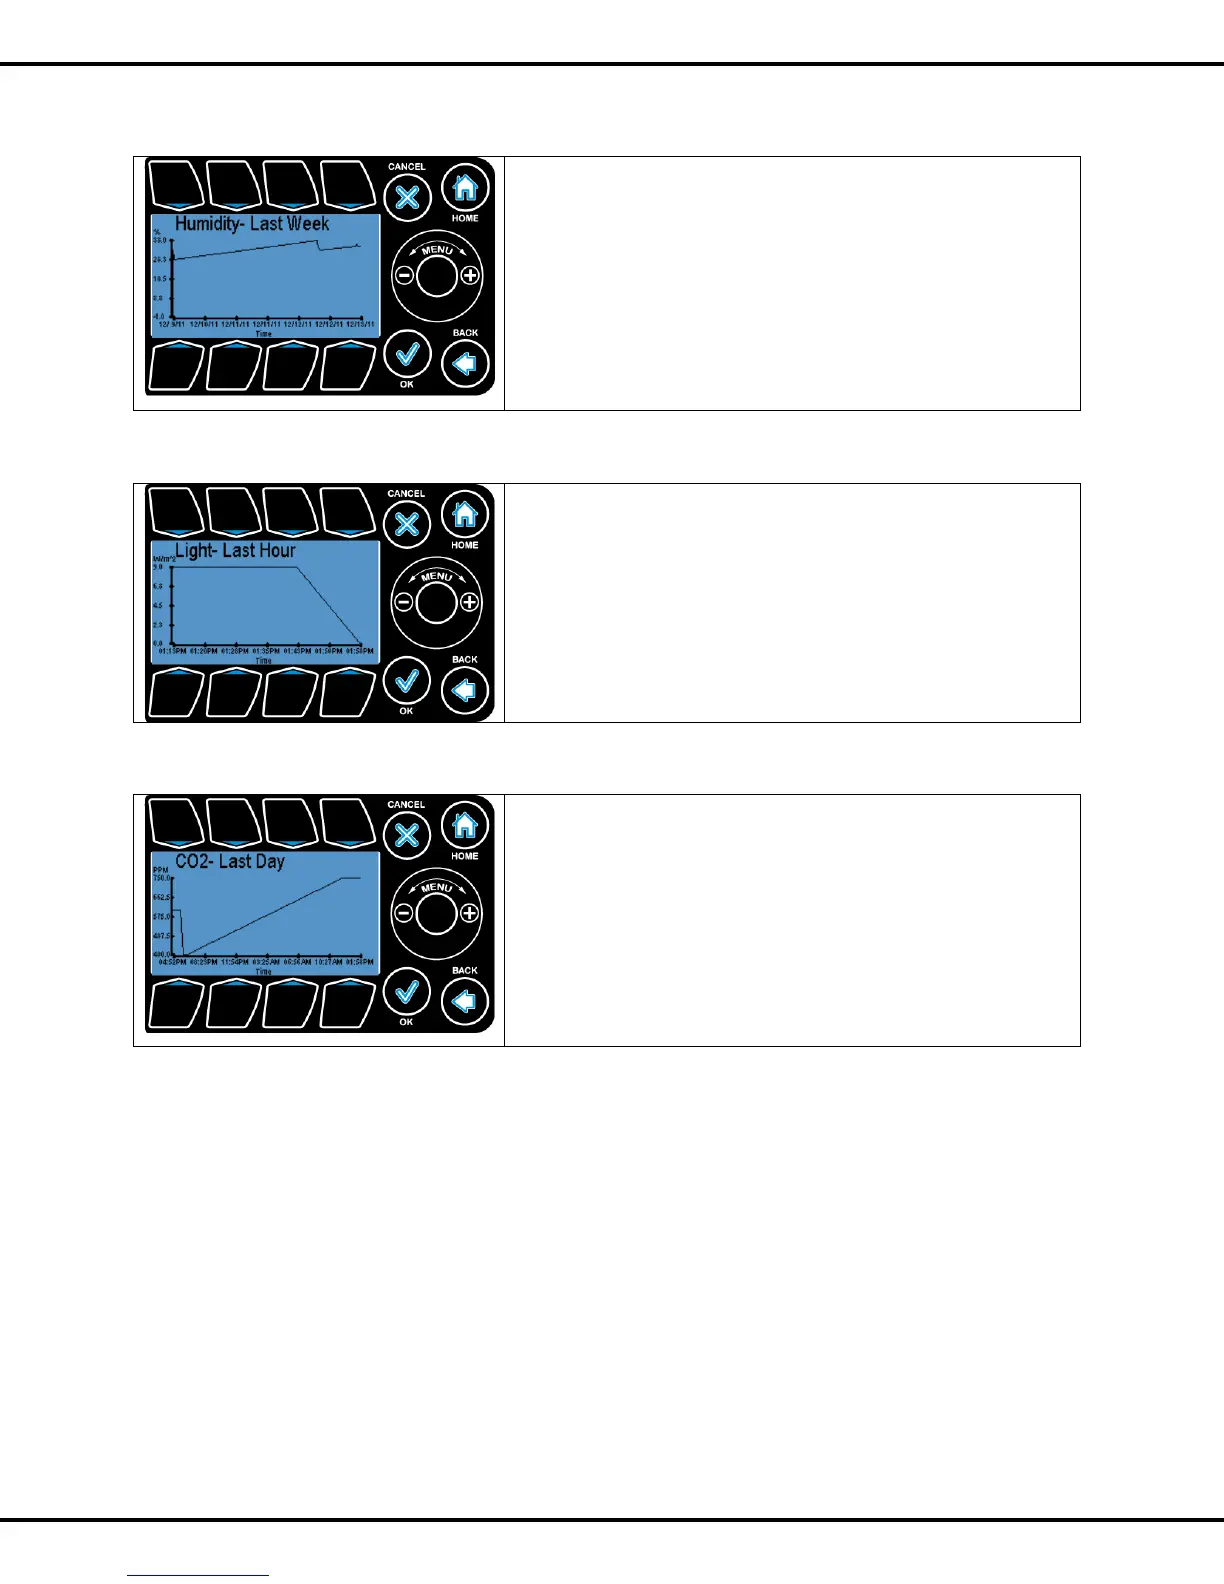
3.2.3 Light
In the light option user can view graphs for the following time periods
• Since Reset
• Last Hour
• Last 24 hour
• Last 7 days
To highlight the sub options Wheel or Buttons #1 - #4 can be used
to go to the corresponding options. Pressing OK will let user can view
the graphs.
3.2.4 CO2
In the CO2 option user can view graphs for the following time
periods
• Since Reset
• Last Hour
• Last 24 hour
• Last 7 days
To highlight the sub options Wheel or Buttons #1 - #4 can be used
to go to the corresponding options. Pressing OK will let user can view
the graphs