28 User Manual
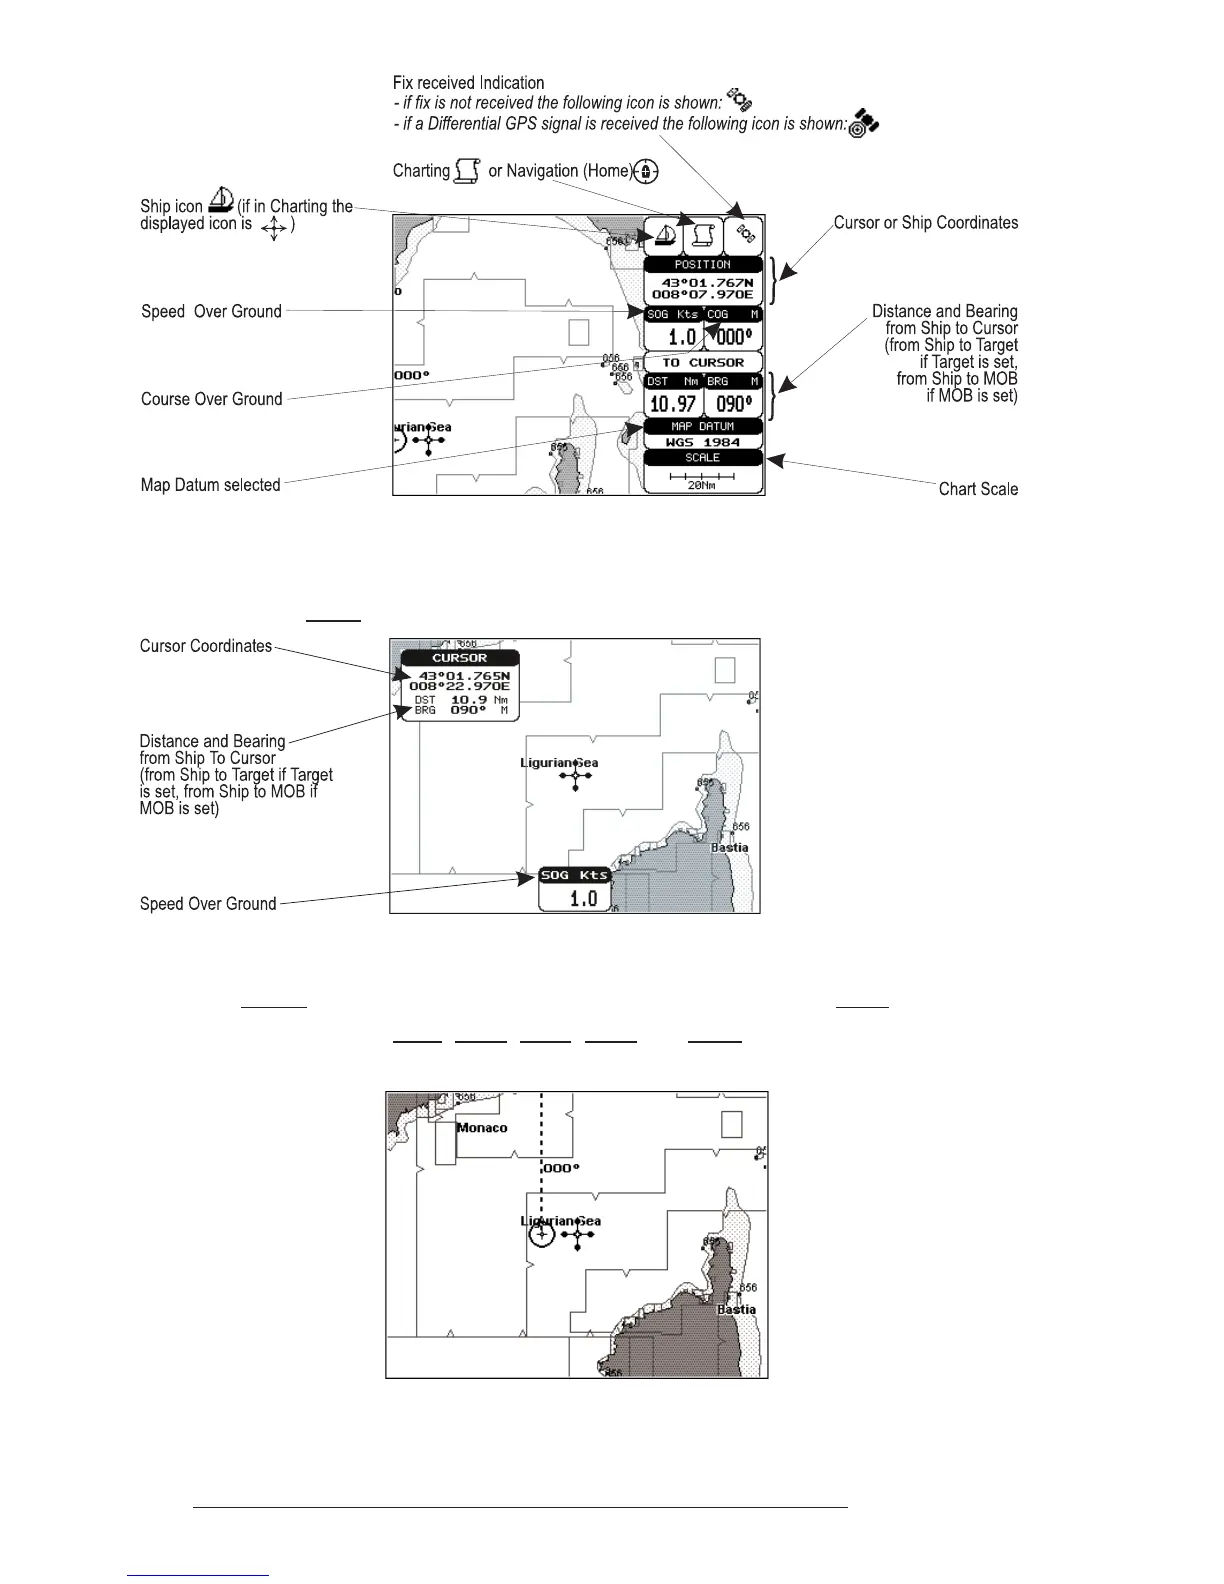
Fig. 3.1.1 - Charts and text area
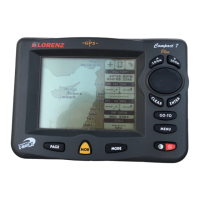
The second is with text area on the bottom line of the screen (with partial
information on SOG):
Fig. 3.1.1a - Charts and text windows
If Target is set, in the previous Fig. 3.1.1a instead of the only SOG information
window, a text line with DST, BRG, XTE, SOG and TTG information appears.
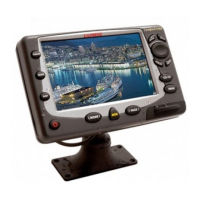
Then it is possible to see on the screen only charts:
Fig. 3.1.1b - Full charts