41
User Manual
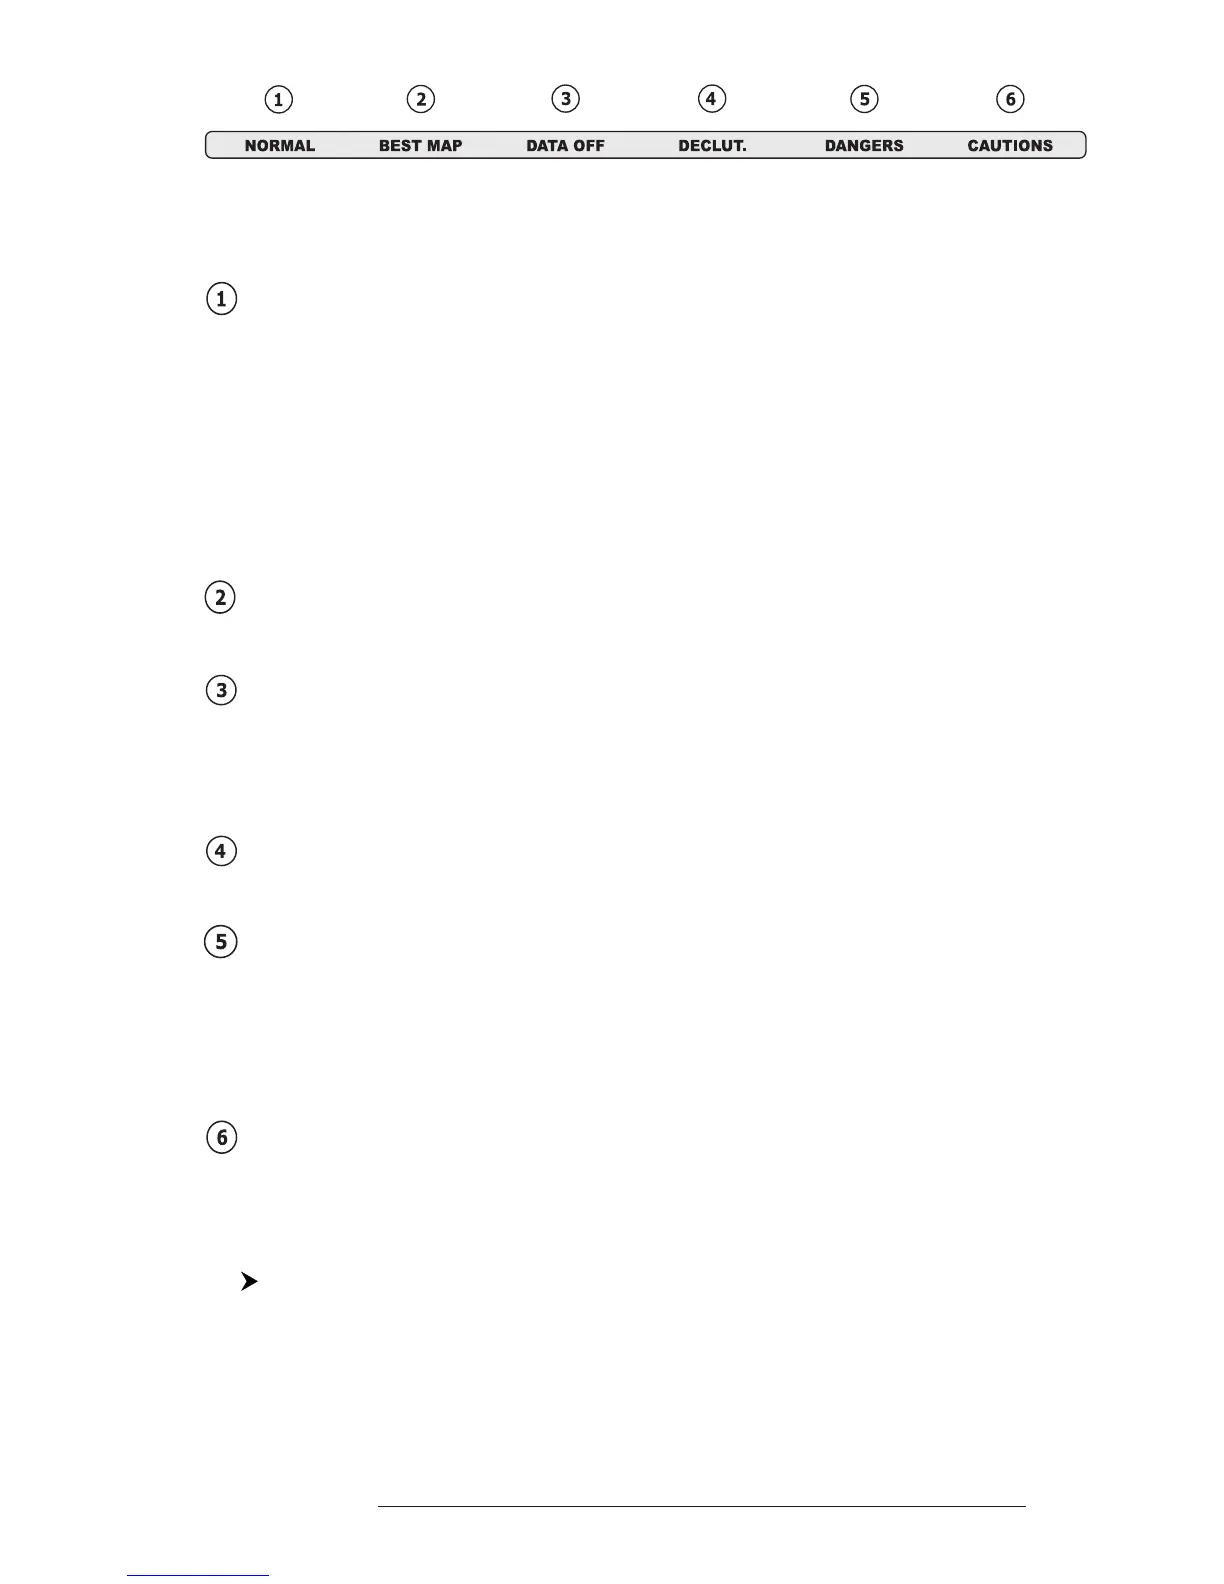
Fig. 3.5.1.8 - Safety Status Bar
Boxes definition is as follows:
Zoom
- Normal: when the chart is displayed at normal scale.
- U. Zoom: red when the chart is under-zoomed out more than twice nor-
mal scale, gray otherwise.
- O. Zoom: red when the chart is over-zoomed in more than twice normal
scale, gray otherwise.
- Chart Lock: red when the chart is zoomed in more than twice normaln
scale, gray otherwise.
Best Scale
Red when a more detailed chart is available under the cursor position.
Data Off
Red when at least one of the following objects or layers is turned off (by the
user): Depths/soundings; Wrecks/obstructions; Tracks/routes; Attention ar-
eas; Nav-Aids.
Clear View
Displays when Clear View function is On.
Dangers
Red when “Guardian Technology” detects one of the following objects: Land,
Intertidal, Depth Area, Rocks, Obstructions, Shoreline Constructions, Fish-
ing Facility, Wrecks, Dragged area, Diffusion area, Mooring facilities, Pingos
and Production installations.
Caution
Red when “Guardian Technology” detects cautionary or restricted area.
3.5.1.9 Currents Prediction
'MENU' + "MAP SETTINGS" +'ENTER' + "Currents Prediction" + 'ENTER'
It is possible to see the variation of the Tidal arrows on the selected area at
any given time. A window is shown on the low-left side of the chart, press 'ENTER'
to set the date and time manually, 'MENU' to decrease time and 'GOTO' to in-
crease time.