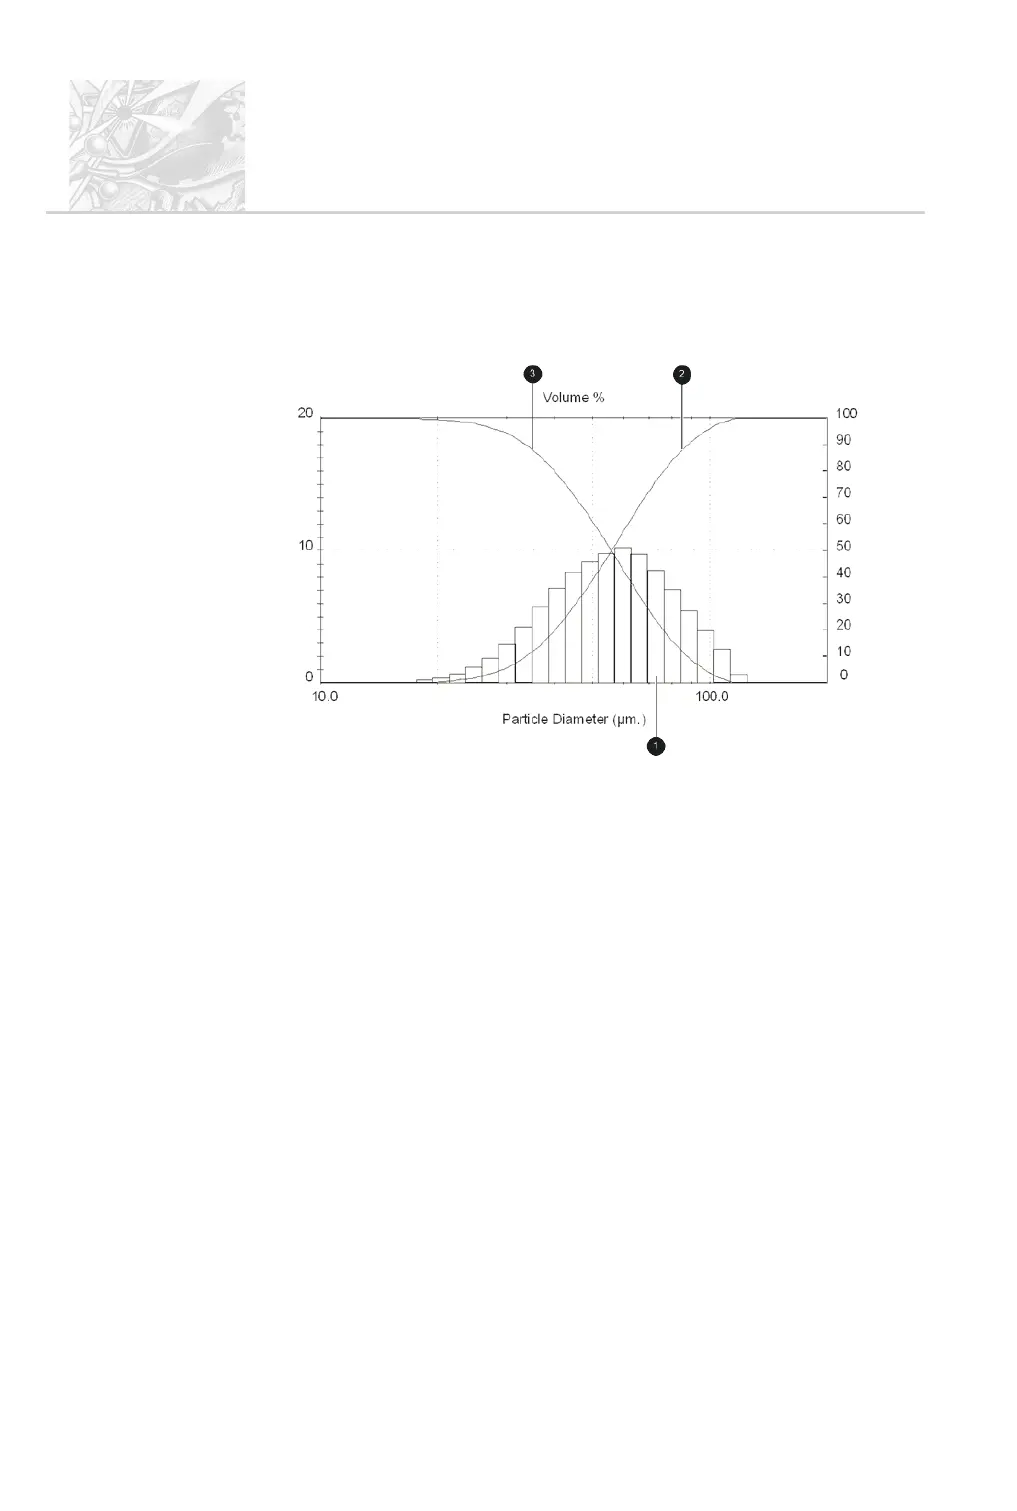
Plot and curve types
Results can be displayed in several ways. This diagram shows three of the more
common ways of displaying the result:
This shows:
+
Histogram – this displays the result as “in band” percentages. Each bar in
the graph represents a size band of particles (52-59mm for example) and the
height of the bar represents the percentage of the spray that is within that
band.
Unless the user changes the size bands (see Chapter 10), the initial analysis
uses size bands set for the detector design.
,
Result-under plot – this is also known as cumulative undersize or re
-
sult less than. It displays the % of the spray which is below a certain size.
The result-under plot is calculated from the initial size bands by fitting a
curve to the analysis data so that values within a size band can be read.
-
Result-over plot – this is also known as cumulative oversize. It displays
the % of the spray which is above a certain size.
CHAPTER 6
Spraytec
Page 6.2 MAN 0368
ILL 7450