The window shows the same set of parameters as the Measurement Parameters
window, but as averages for the range of records selected. This can be the whole
measurement or a subset of records; the online help shows how to select a range
and calculate averages.
The Event line, the fourth line in the window, shows the range the data are based
on. Right-click to change the view to a different view type.
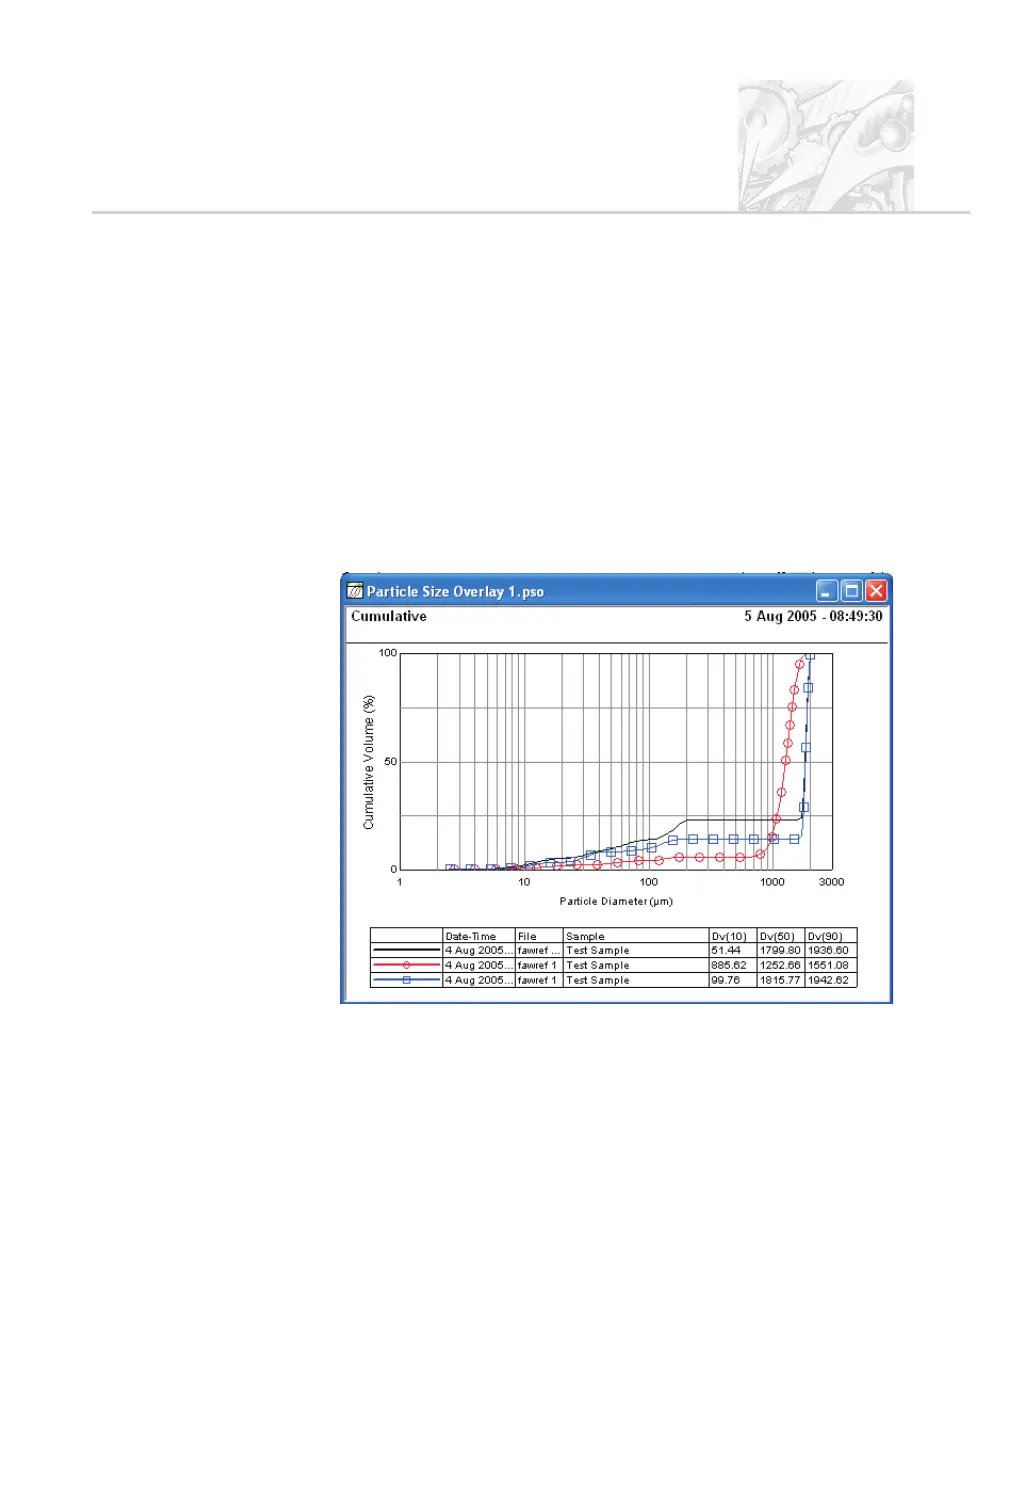
Overlay window
An overlay is used to compare data from up to eight Particle Size Distributions.
These are shown in a window like that shown below. This example shows data
for three separate distributions:
The window can show data on the following:
.
Cumulative (as shown above).
.
Frequency.
.
Corrected light.
.
Light Background.
.
Dark Background.
To switch to any of these views, right-click on the window and select it in the list
displayed. For more details on producing overlays, refer to Chapter 6.
CHAPTER 4
Spraytec Page 4.13