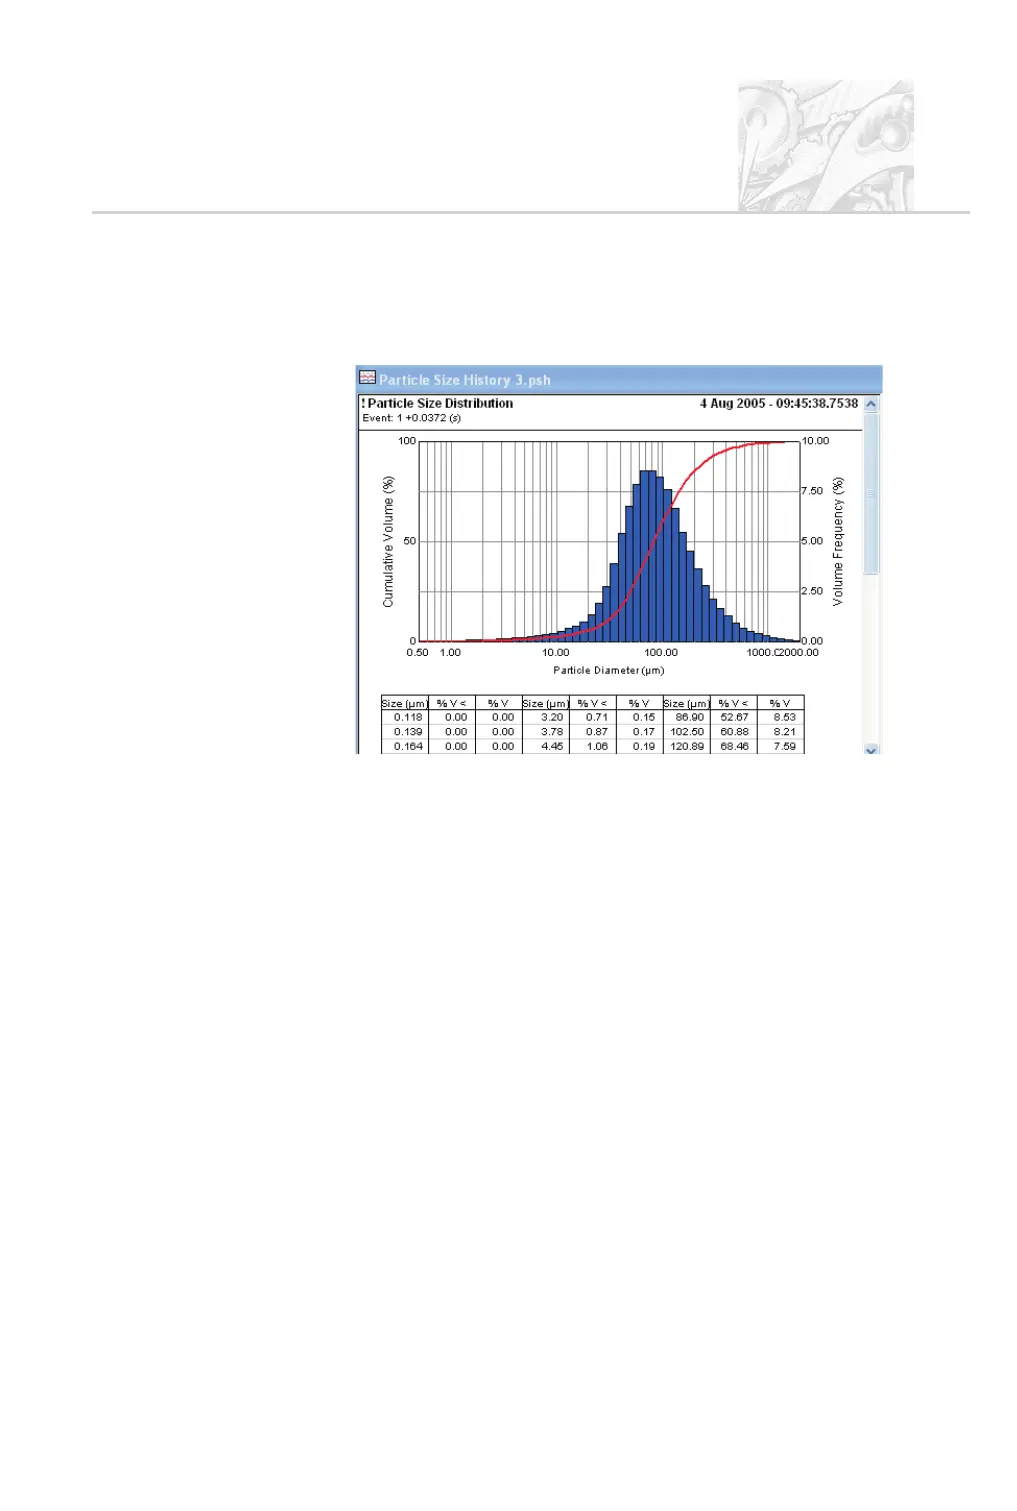
Particle Size Distribution view
The Particle Size Distribution view shows two graphs, a histogram and a
cumulative result-under curve:
The histogram displays the result in the form of “in band” percentages. Each bar
in the graph represents a size band of particles and its height represents the
percentage of the spray that is within that size band. The user can edit the bands
used.
Right-click on the view to change its properties.
The table below the histogram and graph shows the numeric values that
correspond to the bars. It has three columns:
.
Size (mm) – the value is the upper limit of the size band. In the above ex
-
ample the first size band is from 0 to 0.118mm.
.
%v< – the cumulative percentage volume below the given size. In the ex
-
ample above 60.88% of the spray has a particle size less than or equal to
102.50mm (refer to the table above). This is what the curve shows.
.
%v – the percentage of the sample that is within a size band. In the above
example 8.53% of the spray has a particle size that falls between 86.90mm
and 102.50mm (refer to the table above). This is what the histogram shows.
There is a row in the table for each size band. Several frequency curves can be
plotted on one overlay to compare results from different measurements; see the
section below.
CHAPTER 6
Spraytec Page 6.9