37
o p e r a t i n g t h e a n a l y z e r
r
3
2
1
2
D
2
D
C
L
T#
D
.
7.44
7.
s
The statistics reported above each chart require a minimum of 5
stored quality control results. The maximum number of stored results is
93 for each level.
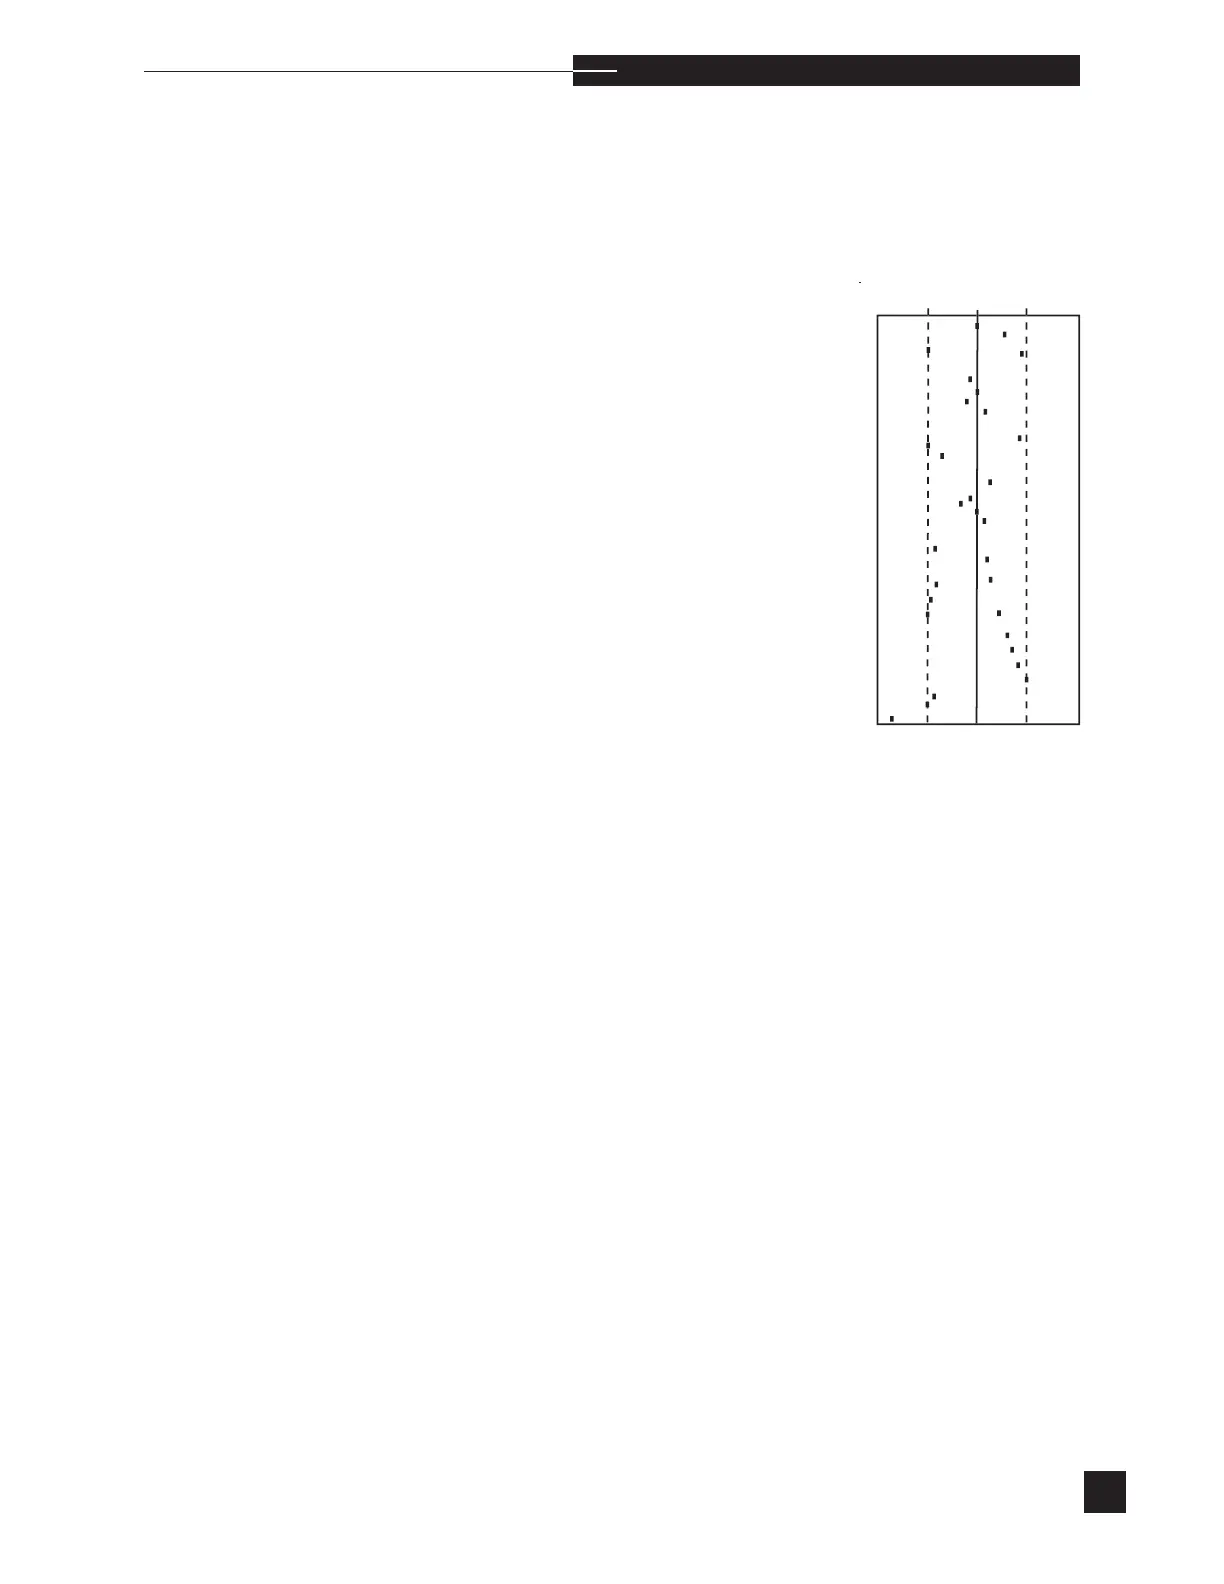
Levey-Jennings Chart:
Levey-Jennings charts plot the measured quality control results for each
day. The calculated mean value is shown by the solid, vertical center
line. The +/- 2 SD values are shown by the dashed lines. The limits of
the charts are the mean +/- 4 SD. The Levey-Jennings charts plot data
for the last 31 days. (See example below.)