85
o p e r a t i n g t h e a n a l y z e r
r
s
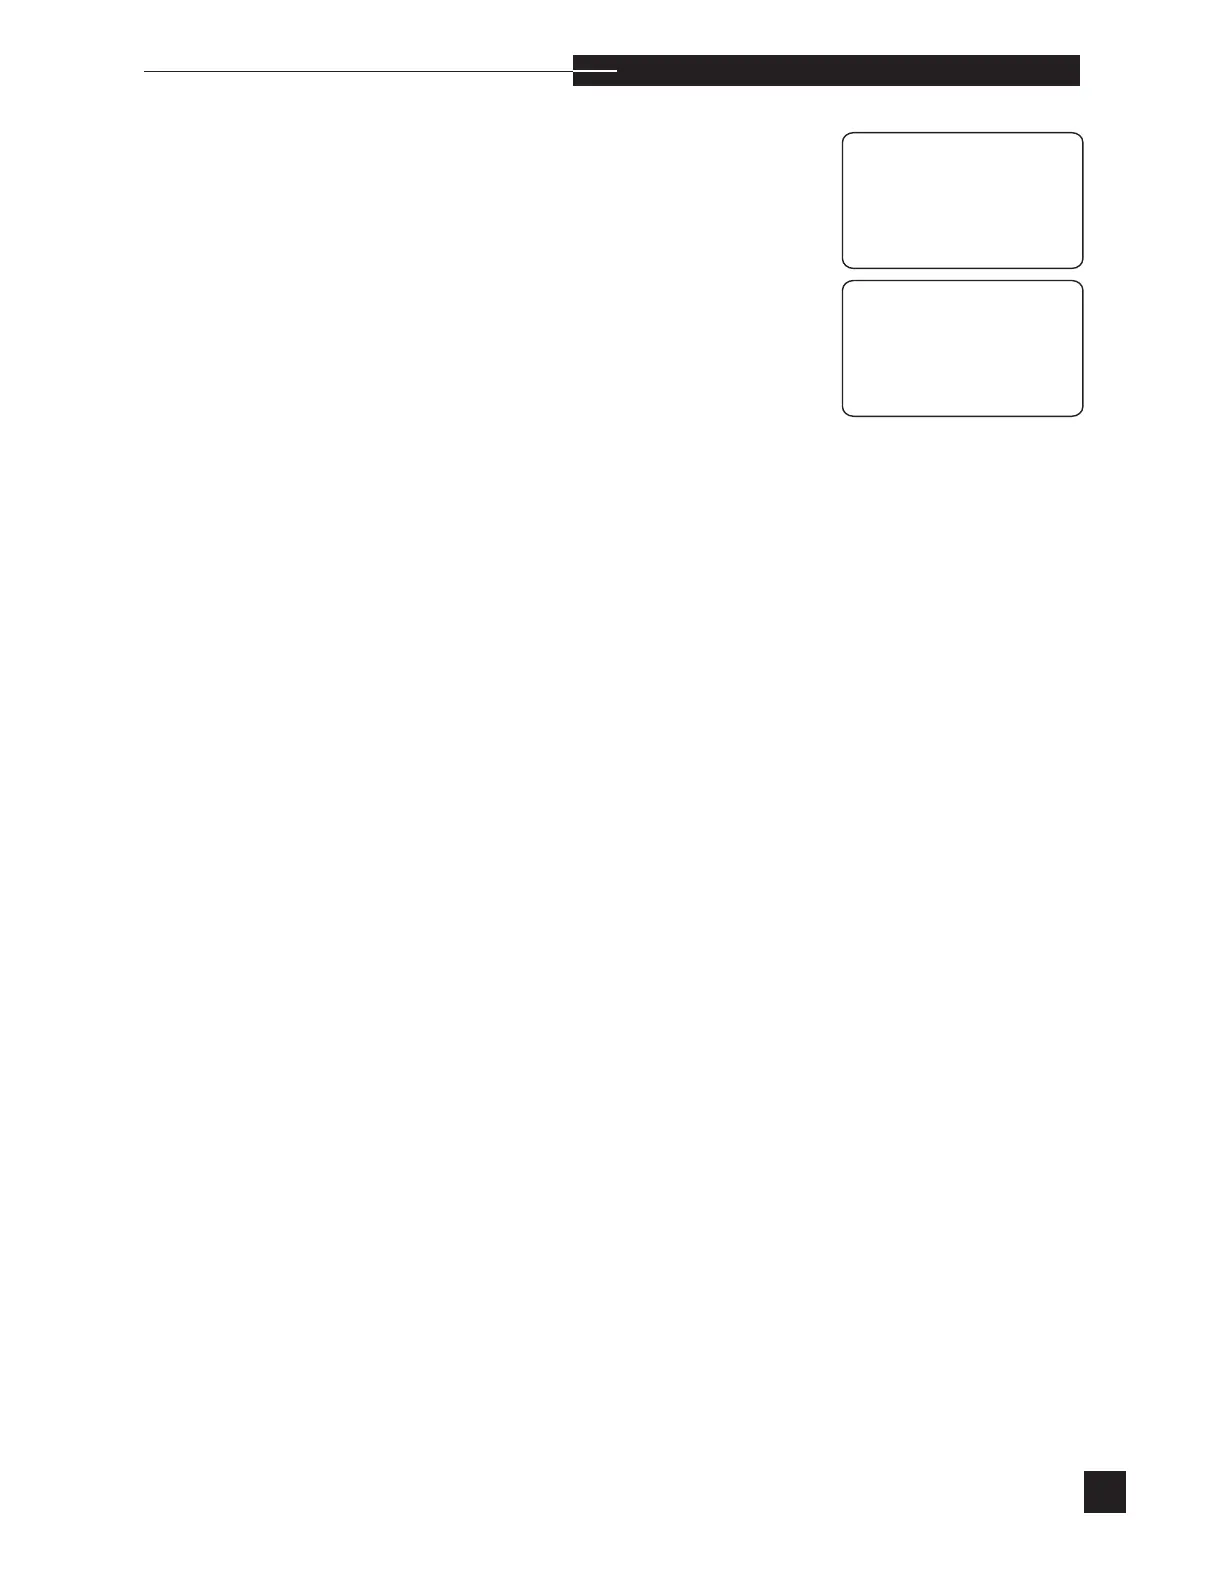
CORRELATION 1/2
SET PARAMETERS
SLOPE INTERCEPT
pH = X.XX X+X.XXXX
PCO
2
= X.XX X+ X.X mmHg
PO
2
= X.XX X+ X mmHg
CONFIRM?
CORRELATION 2/2
SET PARAMETERS
SLOPE INTERCEPT
Na
+
= X.XX X+ X.Xmmol/L
K
+
= X.XX X+ X.XX
Ca
++
= X.XX X+ X.XXmmol/L
Hct = X.XX X+ X%
CONFIRM?
mmol/L
sCa
++
is replaced with Cl
-
when Cl
-
mode is selected.
Next, select CORRELATION, then SET PARAMETERS to
view the stored correlation equations. To change any of these values,
press NO to CONFIRM?, and enter any new correlation slopes
and/or intercepts for each analyte. The cursor highlights the selection.
Press the number keys to set the slope and intercept, and press YES to
confirm the correct individual values. Press NO to change “+” to “-”,
then press YES.
When entries are complete, press YES and CONFIRM? is dis-
played. To correct mistakes, press NO to return to the top of the list,
and re-enter numbers. Press YES to confirm your entries. The pH,
PCO
2
, PO
2
, Hct, Na
+
, K
+
, Ca
++
and Cl
-
slope input range is 0.90 to
1.10. The acceptable intercept input range for pH is -0.020 to 0.020,
PCO
2
is +/-5 mmHg and PO
2
is +/-10 mmHg, Na
+
is +/-10 mM,
K
+
is +/- 0.6 mM, Ca
++
is +/- 0.6 mM, Cl
-
is ± 10 mM, and Hct is
+/- 4%. The default values are: slope =1.00 and intercept = 0.00.
Finally, analyze patient samples on each analyzer to confirm the cor-
relation. Correlation values can be applied to patient and/or quality
control results. Correlation is not applied to normal, critical, or quality
control ranges.
Using correlations does not change the measurement range, only the
displayed range. The following is a detailed example for pH. The
measurement range is 6.500 to 8.000. If the pH correlation is 1.00x
+ 0.020, the display range is: 1.00 (6.500) + 0.020 to 1.00 (8.000)
+ 0.020 or 6.520 to 8.020. Using this example, if a sample had a
measured pH less than 6.500, the result would be reported as
< 6.52↓↓.