82 TM1700-SERIES ZP-BL16E BL1448GE
9 DATA ANALYSIS
Zoom In
Zooms the x-axis (time). Select zoom in, position the
mouse at the left of zooming area, move the mouse
to right of zooming area while holding down left but-
ton. Release left button. This function is also available
on the tool bar.
Zoom Out
Restores the display to the original setting.
Toolbar
Show/hide toolbar.
Status Bar
Show/hide status bar.
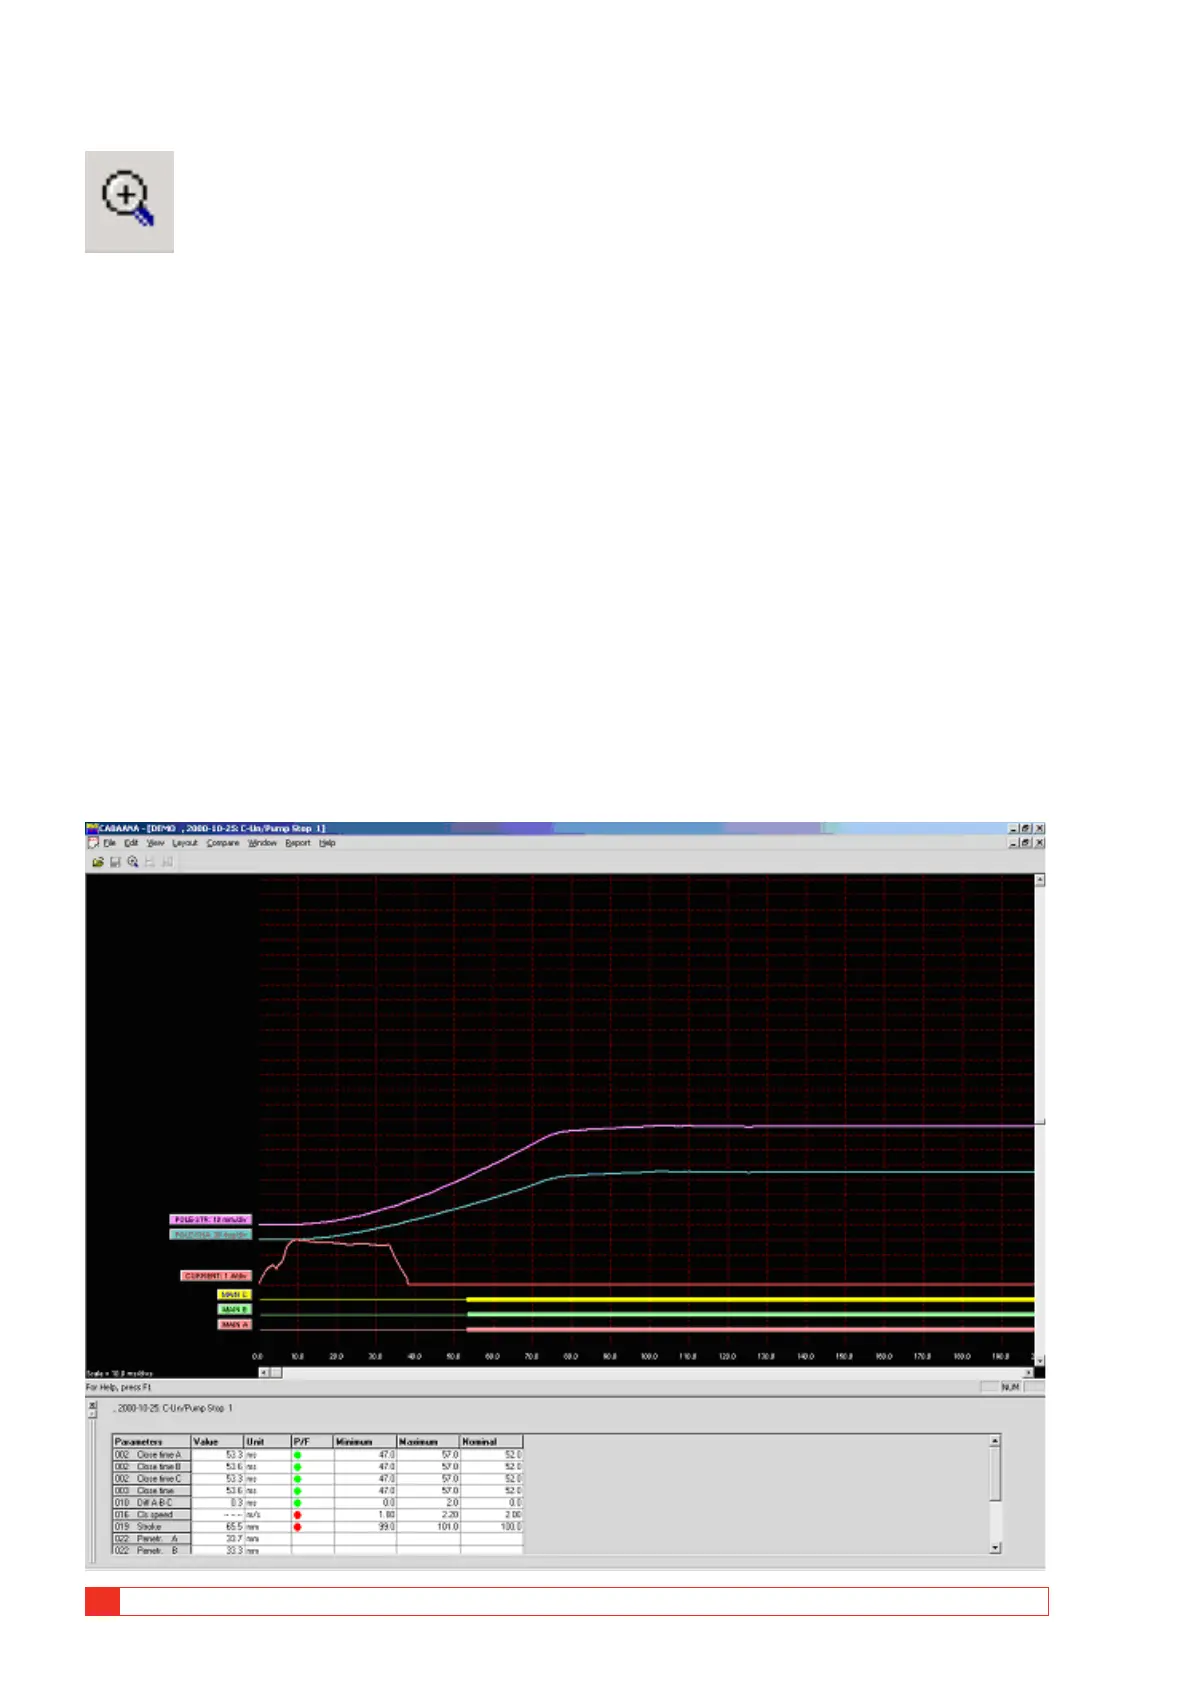
Parameter Window
Opens a parameter window used for measured/calcu-
lated parameters. To view all parameters use the scroll
bar in the parameter window
Graph Window
Labels
Double-clicking on any of the graph labels will open a
dialogue box used for making display settings.
Lower Scroll bar
Changes x-axis offset.
Right Scroll bar
Changes y-axis offset.
Layout menu
Graph
Opens dialogue box used for graph settings. On/
off, colours, position, scaling etc. Selecting “store as
current” or “store as original layout” will save the set-
tings while you work with the actual test or save the
settings as original settings for the test.
Display
Opens dialogue box used for display settings. Grid on/
off, x/y-scales and offsets, colour/monochrome etc.
It is also possible to change the graph and display
directly on the screen by double-click on a label (graph
 Loading...