Version 1.9 Page 150 of 170
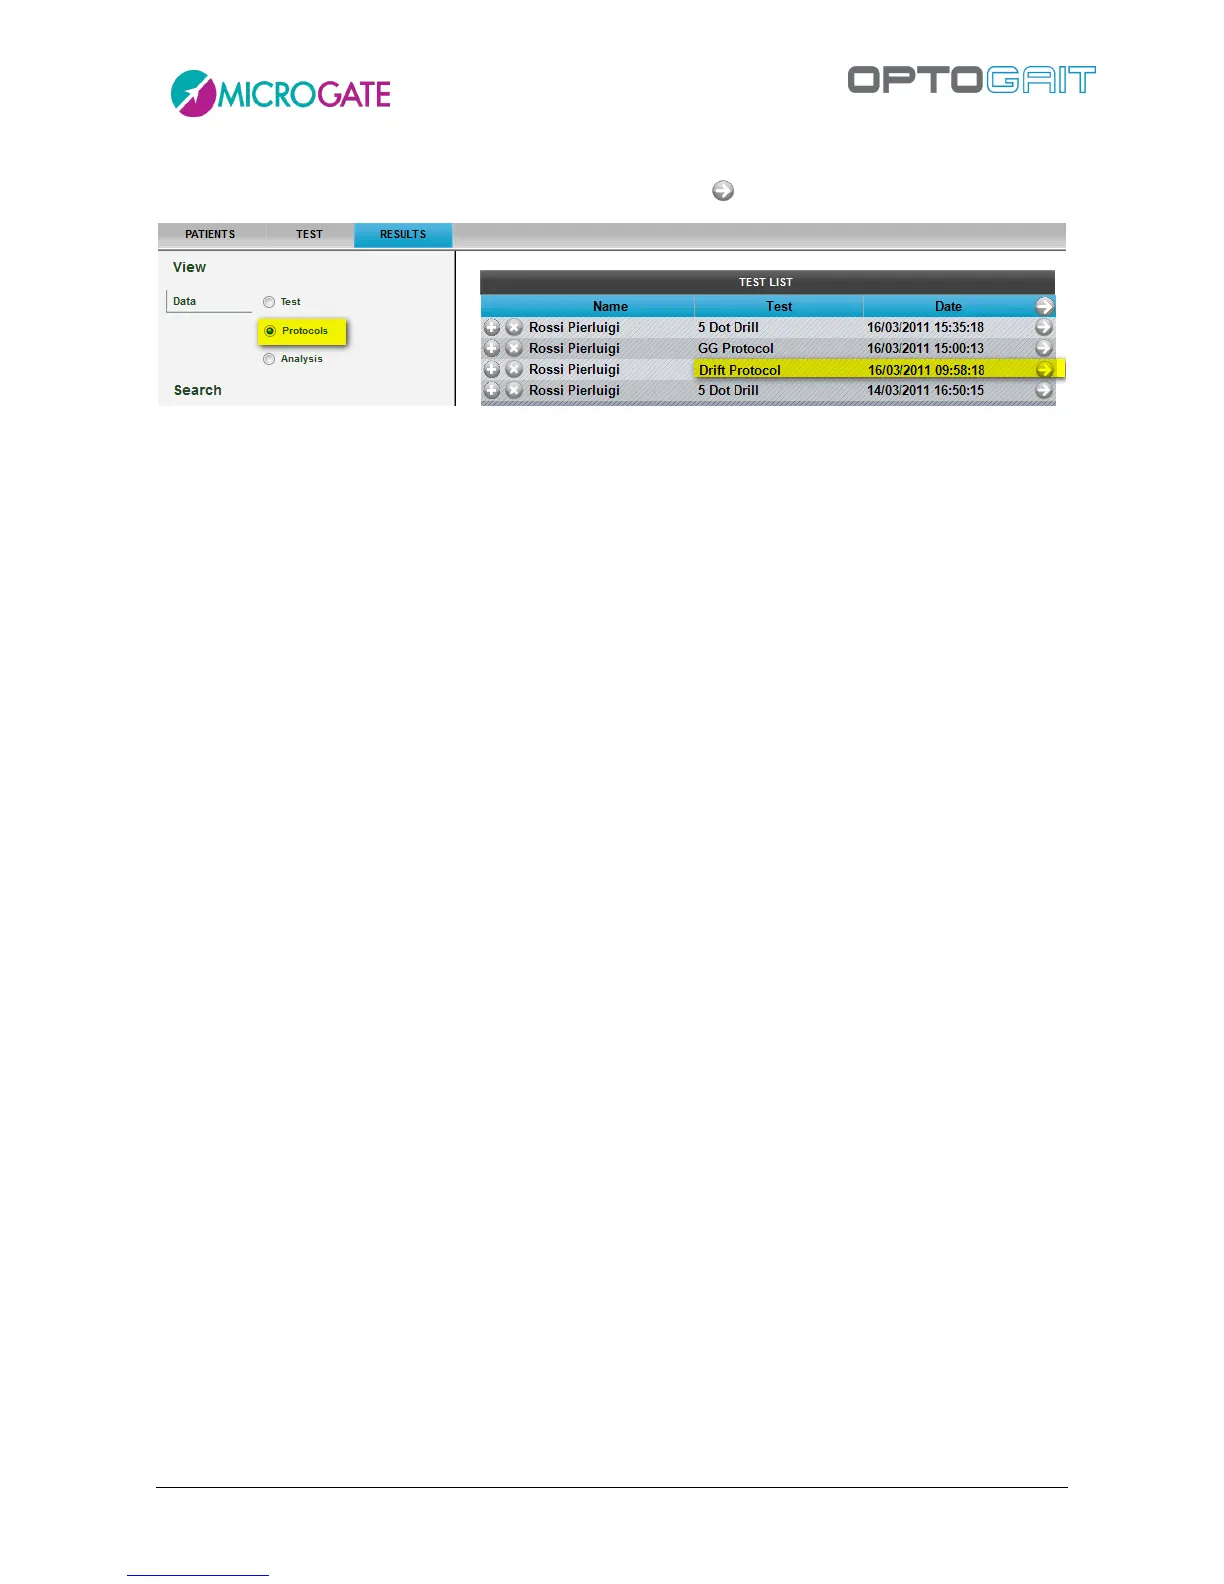
At the end of the protocol go to Results, select the option 'Protocols' from Display>Data and choose
the protocol which has just been executed, with the symbol
Figure 125 - Selecting a protocol to be printed
Double-click on the protocol to be analysed (or click the button <Display>); a report will be displayed
showing the average jump values divided into right and left leg and, what's even more important,
two graphs allowing to quantify very rapidly the displacements and their direction.
Each jump is displayed as a yellow dot (if you can not see 10 dots per leg some might be superposed);
the two large red and green dots (left and right) represent the athlete's tendency to move into a
certain direction (e.g. upwards to the right), whereas the dotted triangle indicates the 'stability
area'.
The position of the red and green dots with reference to the origin of the two Cartesian axes gives
a first indication of the athlete's average landing point compared to the starting point. As these
represent an average, their position could be misleading: for example, given the absurd assumption
that an athlete carries out a perfectly central jump, two completely to the right and two completely
to the left with two displacements of exactly the same entity, the dot will be placed exactly in the
centre giving the impression that the athlete always jumped perfectly.
But in this case the rectangle with the dotted area representing the standard deviation of jumps
can be helpful. The larger the displayed area, more has the athlete drifted (moving away from the
point of origin) when landing, and as a consequence his dynamic stability is lower.