61
Diagnostics
Chillgard 5000
US
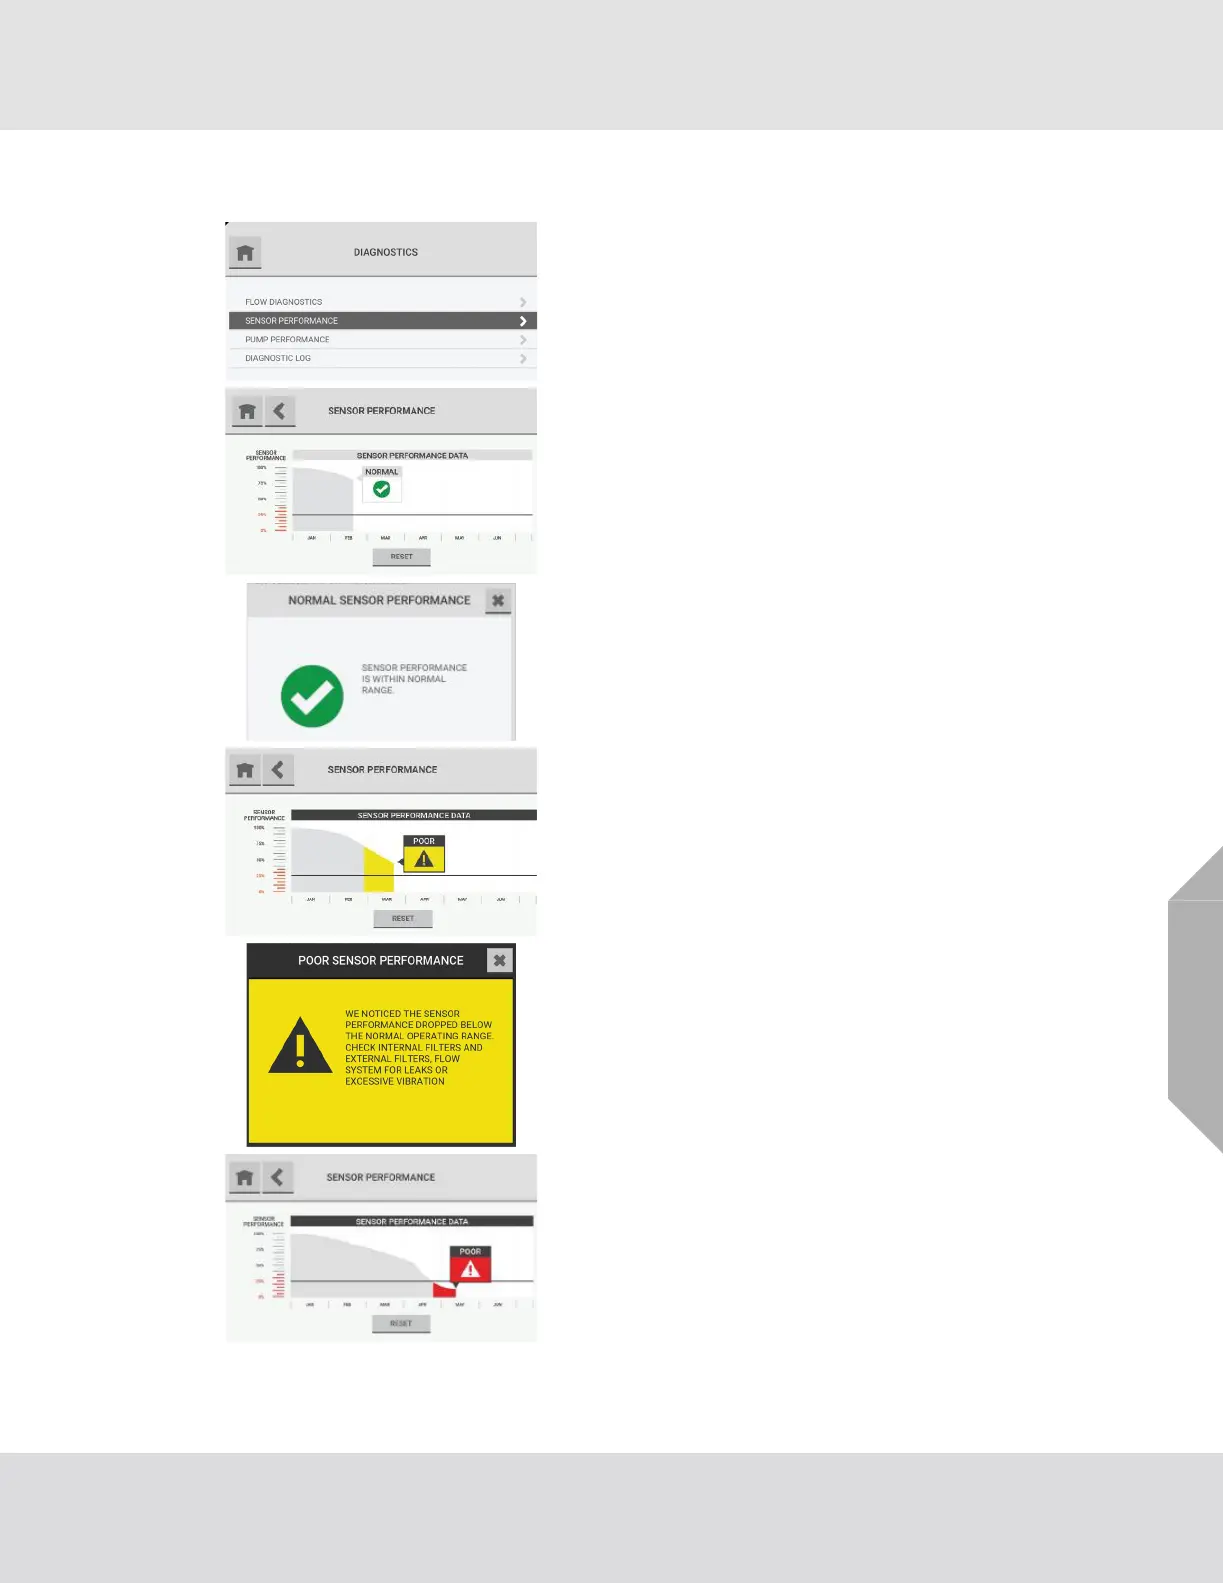
8.2 Sensor Performance
(1) On the dashboard, select the "Diagnostics" button.
(2) On the "Diagnostics" screen, select "Sensor Perfor-
mance".
The "Sensor Performance" screen shows a graph of sensor
performance over a 6-month interval. The graph is divided
into quadrants. Each quadrant indicates a particular sensor
status.
The top left quadrant is associated with normal perfor-
mance.
To see details about sensor performance, select the text
box.
The bottom left and top right quadrants show predictive
warnings in yellow. When the highlighted section shows
below the trend line, it identifies the Poor threshold.
To see details about sensor performance in this quadrant,
select the text box.
The bottom right quadrant shows predictive warnings in
red. When the highlighted section shows below the trend
line, it identifies the Poor threshold.