63
Diagnostics
Chillgard 5000
US
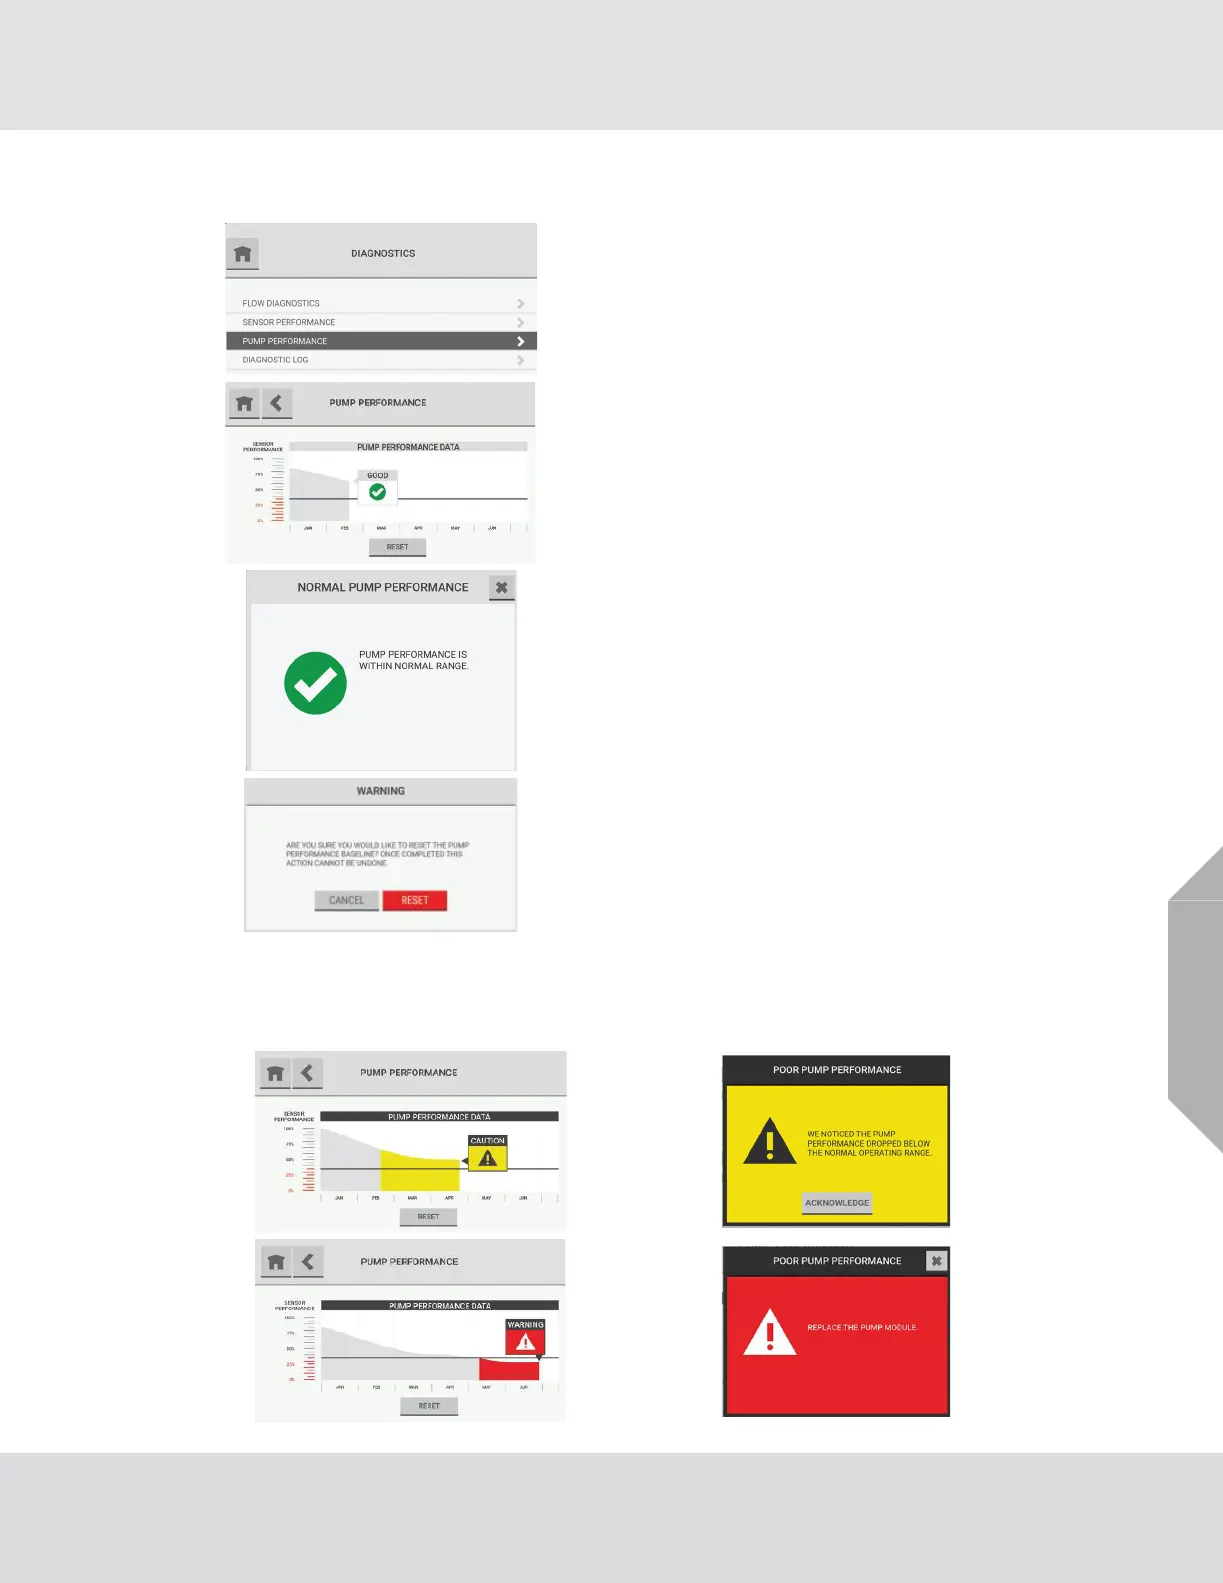
8.3 Pump Performance
The region of the graph that is below the predictive warning threshold shows in yellow or red,
depending on the severity of the performance degradation. To see details about pump performance,
select the text box.
(1) On the dashboard, select the "Diagnostics" button.
(2) On the "Diagnostics" screen, select "Pump Perfor-
mance".
The "Pump Performance" screen shows a graph that plots
pump performance over time.
To see details about pump performance, select the text box.
To reset the pump performance baseline, select "Reset".
In the Warning pop-up, select "Reset" to continue the reset
function or "Cancel" to cancel it.