12 Multi-Channel Power Mode
218 IDA-3106 Narda
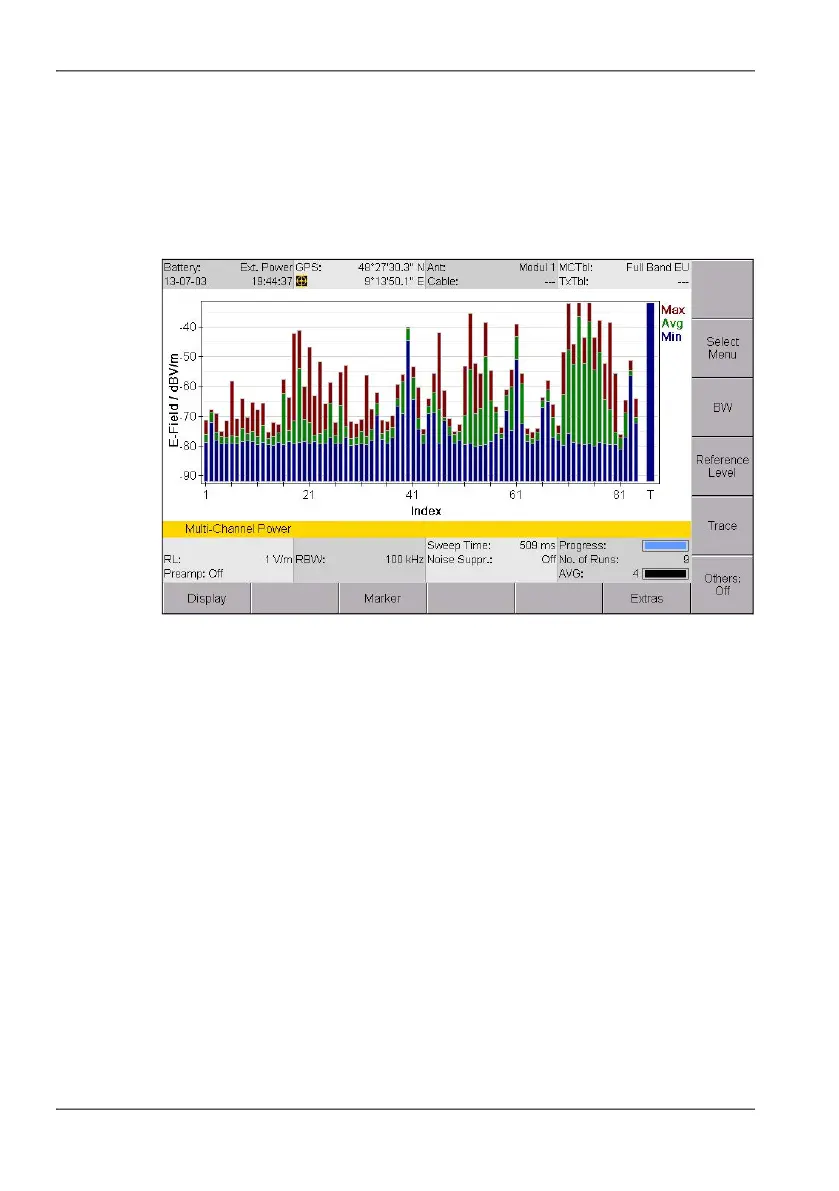
12.4 Using the Bar Graph view
The measured values are shown as bars in the Bar Graph view. The
selected trace types are shown as abbreviations on the right side of the
diagram and shown in the corresponding colors in the diagram. The Marker
menu is available here for evaluating the display, unlike the Table view.
Figure 52: Bar Graph view in Multi-Channel Power mode
NOTE: Information about the status bars is found under The upper status bar on
page 47 and The lower status bar on page 48.