SECTION 2: GETTING STARTED
23 REI OSC-5000E
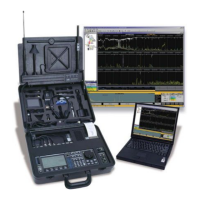
graph at the top of the screen shows the differences in the spectrum. Even if there is no
threat, there will be some differences in the traces due to intermittent transmitters and the
differences in the environment. It should be very easy to recognise signals that are unique
to the target environment. The strongest signal that shows up on the both the Peak trace
and the inverted difference plot should be the test transmitter located near the OSCOR.
Some of the signals in the above graph are labeled.
Select and zoom in on the
desired signal of interest
using the EXPAND and
NARROW buttons.
Use the SWEEP/ANALYZE
button to enter the Analyze
mode. Adjust the volume and
listen to the signal. As the
volume is increased, you
should hear feedback.
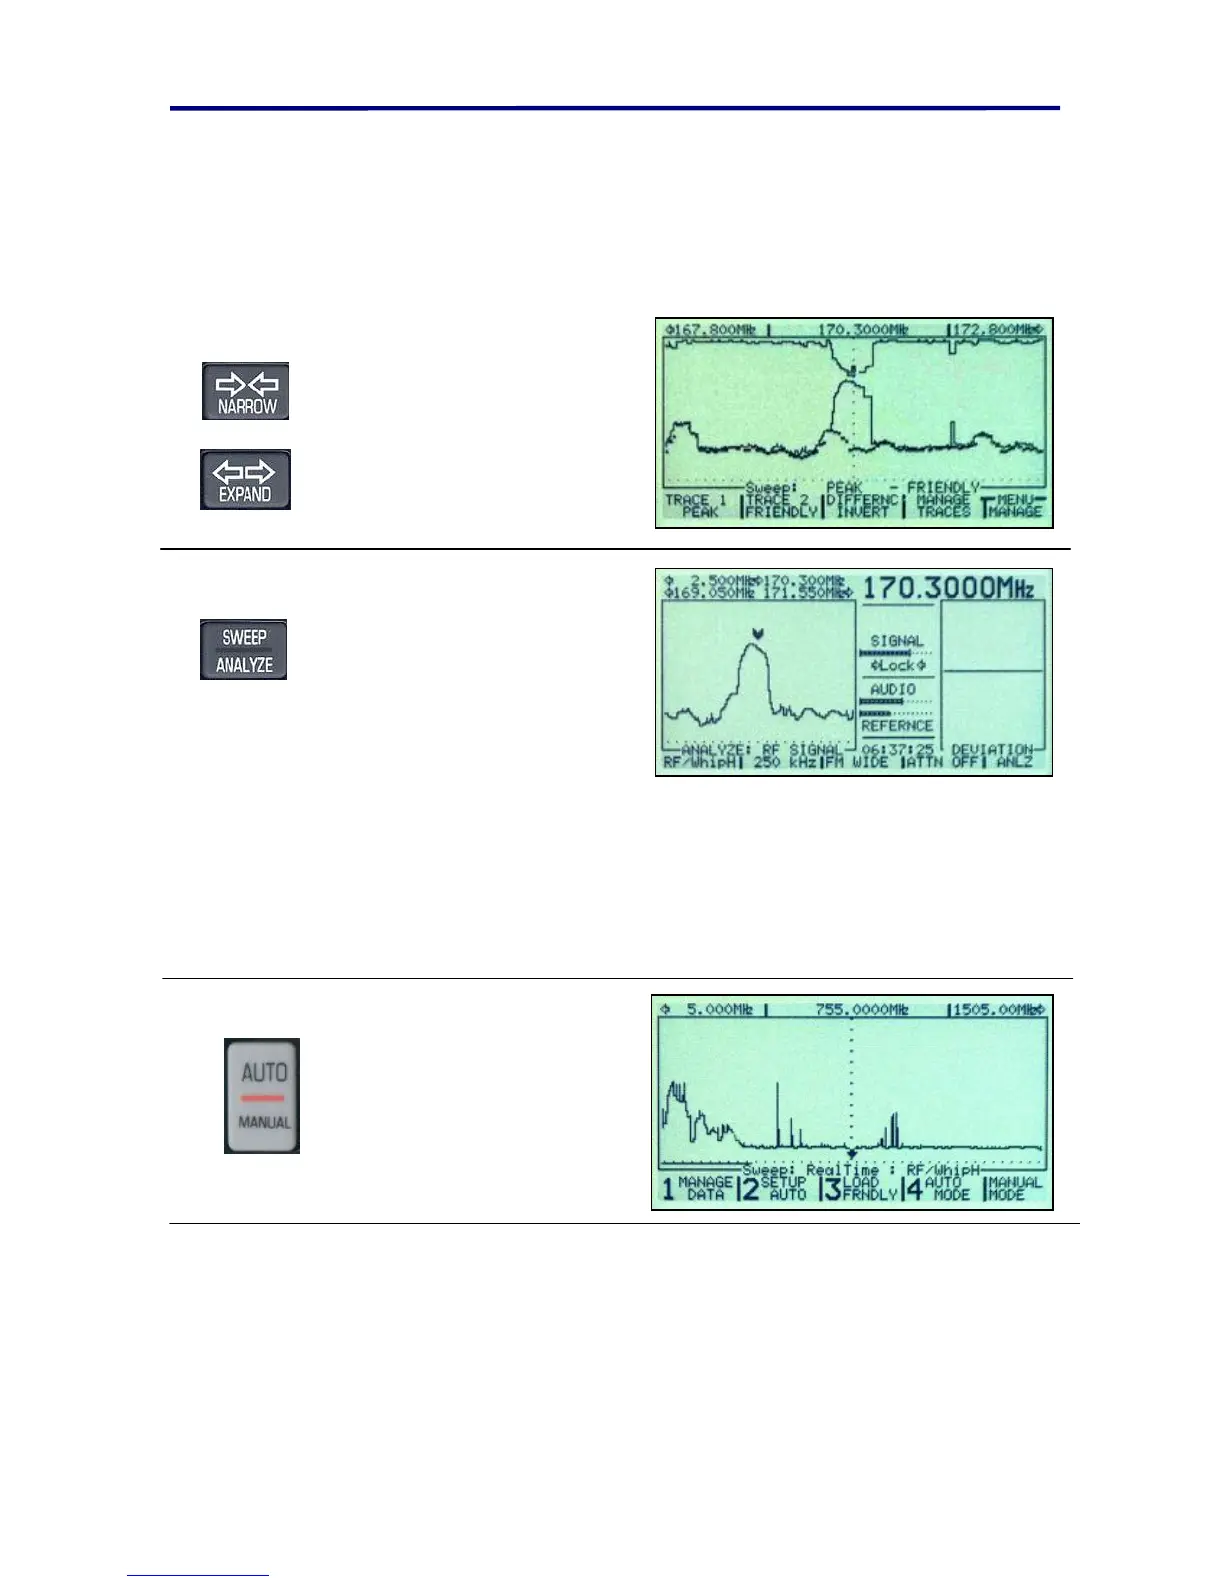
3b. Automatic Mode to find threat signal
This exercise assumes that the Loading Friendly portion of the previous exercise has just
been completed up to the point where the OSCOR is brought back into the target
environment. With the OSCOR in the target environment, turn on an analog testing
device. The same device described in the previous exercise is recommended.
Place the OSCOR in the
middle of the room and press
the AUTO/MANUAL button.
In this exercise, we are using the OSCOR default settings for inputs, outputs, and
correlator settings.
Turn on some music in the target environment. This will help with the correlation process.
Easy-listening or country music is recommended because it has a lot of tone and little
distortion.