Item Function Name of the pictogram in
the operating instructions
6 Leak rate unit -
7 Access to the menu Settings [SETTINGS]
8 Function key bar -
9 Display/Hide an area [EXPAND]
10 High decade (max) of the bargraph -
11 Leak rate bargraph display (color according to test result) -
12 [i Next] indicator: error/warning message to be viewed [i Next]
13
1)
Analyzer cell pressure -
14
3)
Set reject point (red plot) -
15
1)
Warning point set (orange plot) -
16 Calibration type selected -
17 Current status of the detector -
18
1)
Detector inlet pressure -
19 Test mode selected -
20 Low decade (min) of the bargraph -
21
1)2)
Sniffer probe flow (if Sniffer method selected) -
22
1)
Set reject point digital display -
23 The color of the screen varies depending on the test result:
● green screen: measured leak rate below the reject point
● red screen: measured leak rate above the reject point
Gray screen: detector in ‘Stand-by‘ mode
-
1) Display according to detector settings
2) Display only
3) Display if test in progress
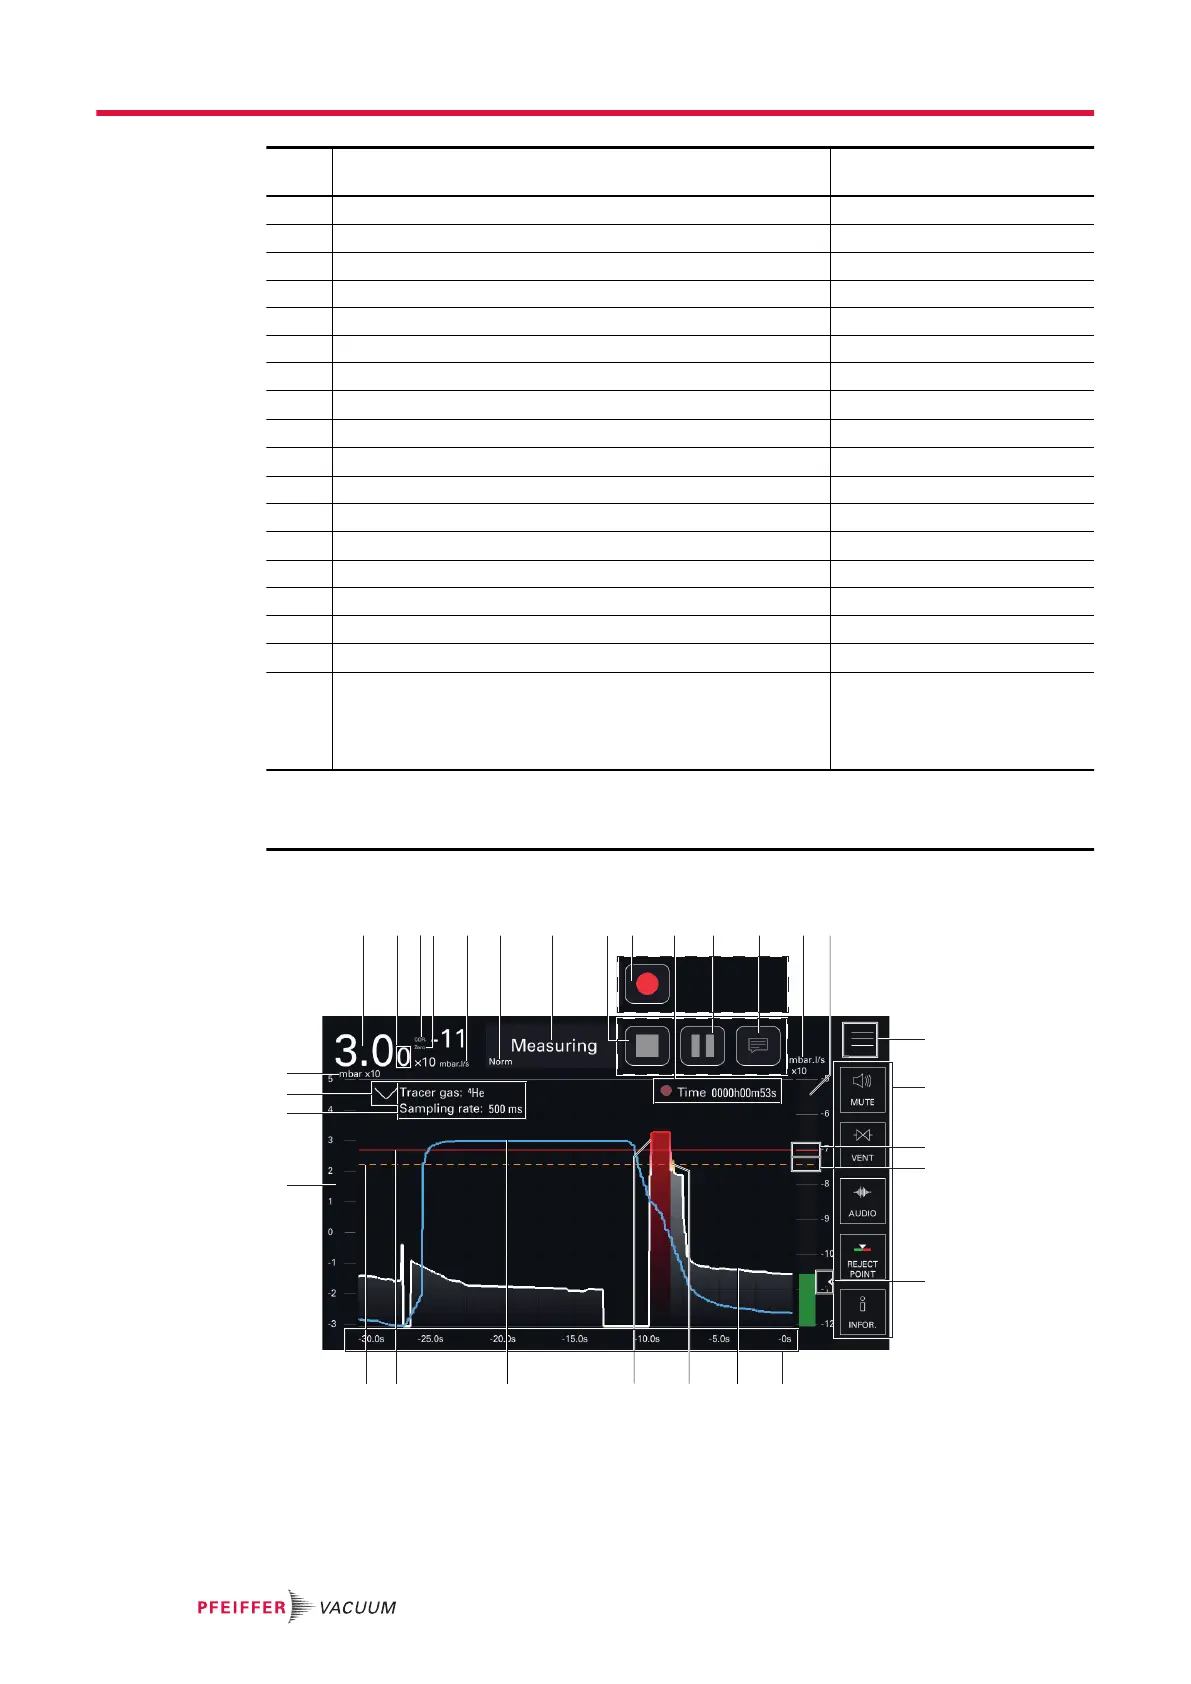
7.7.3 Graph screen
14
15
18
17
16
98 10432 11 121 5 13
1917 2116
20c 20b
20a
75
25
24
23
22
6
►
Press on the screen to access the graph settings (see chapter "Graph screen: graph parame-
ters").
Operation
34/98