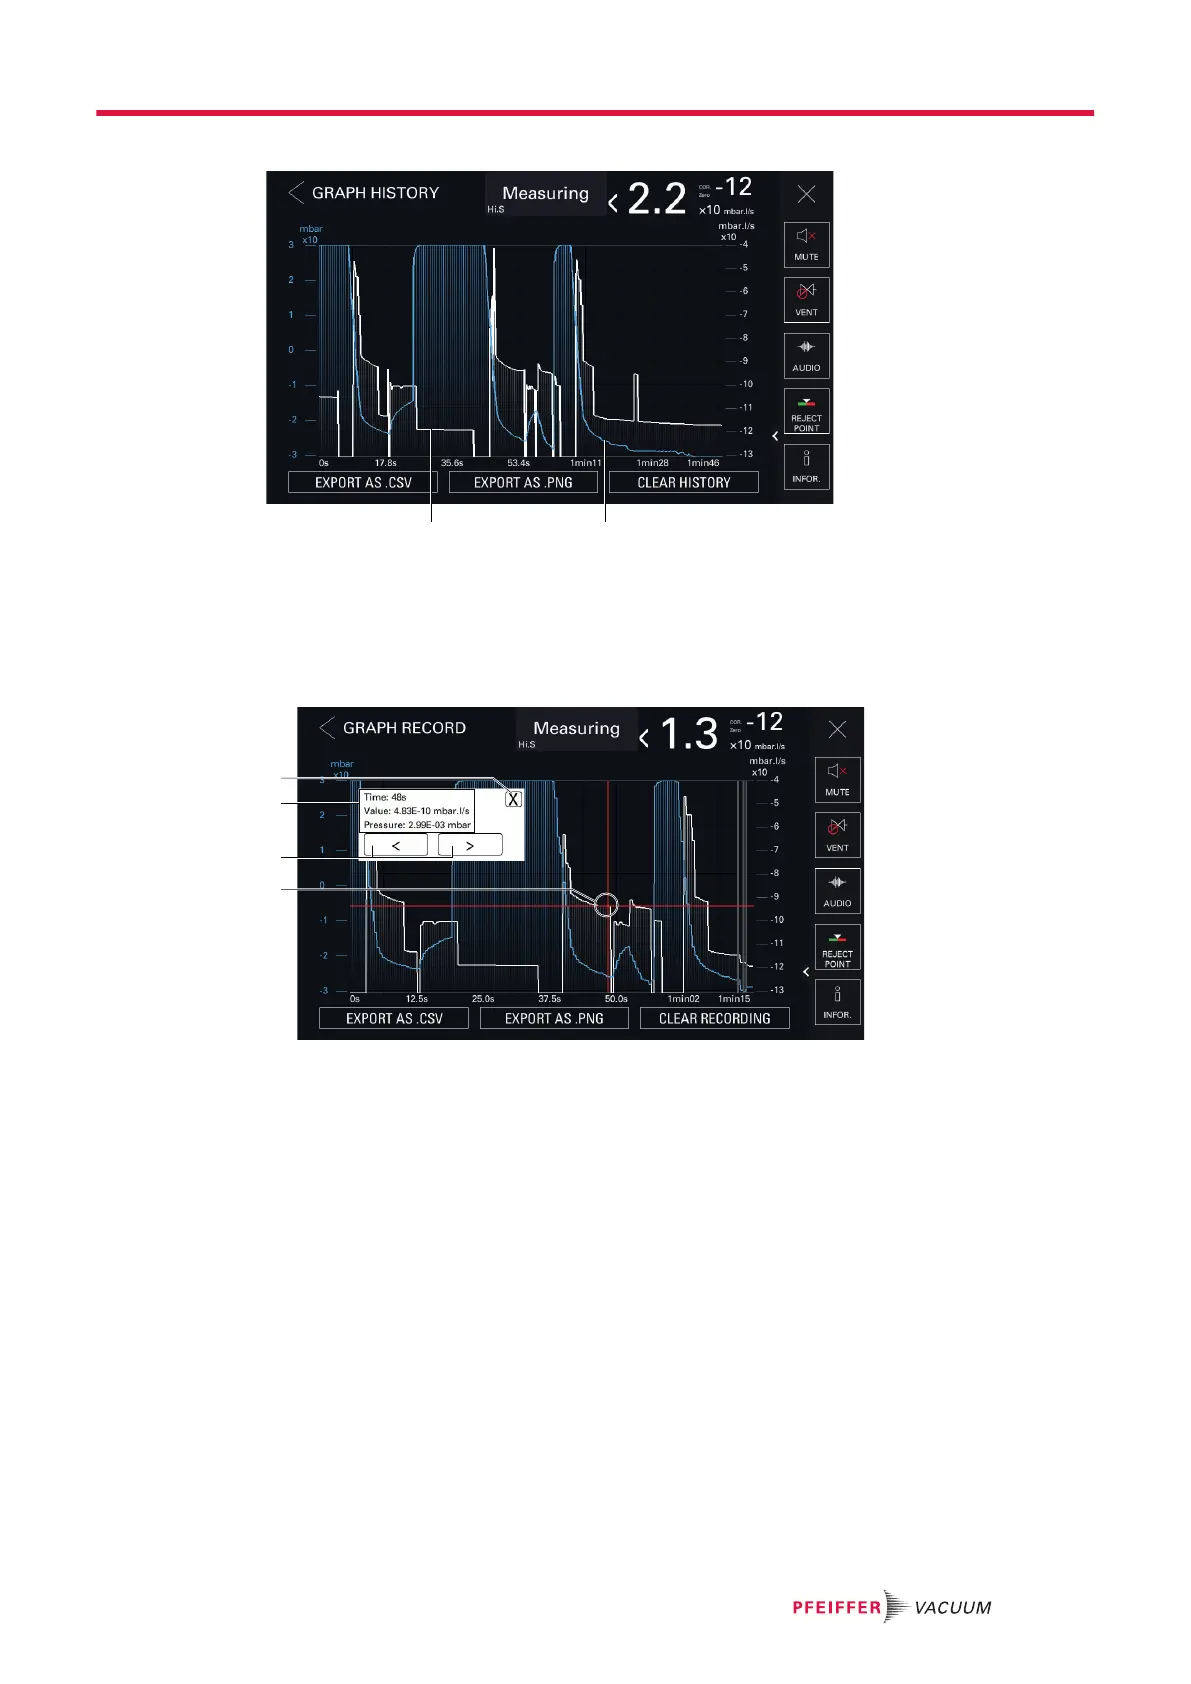
Graph history
1 Leak rate plot (white) 2 Inlet pressure plot (blue)
7.7.9 Details of a measurement
The user can view the details of a measurement (leak rate and inlet pressure) for each point of the re-
cording in progress, the graph history, or saved recording (.csv file).
1 Window closes 2 Details of the selected measurement:
─ Time: the time of measurement with regard to the end of the recording
─ Value: exact value of the leak rate measured
─ Pressure: exact value of the inlet pressure measured
1. Press the measurement point on the plot to be viewed until a red cross appears.
●
A window with details appears.
●
Press [X] to close the window.
2. To adjust the selection, move forward/backward from point to point by pressing the navigation
tools.
7.7.10 Zoom function
At any time, it is possible to zoom in on the display.
A pictogram appears once the zoom function is enabled. It disappears when the zoom function is no
longer applied.
Operation
41/98