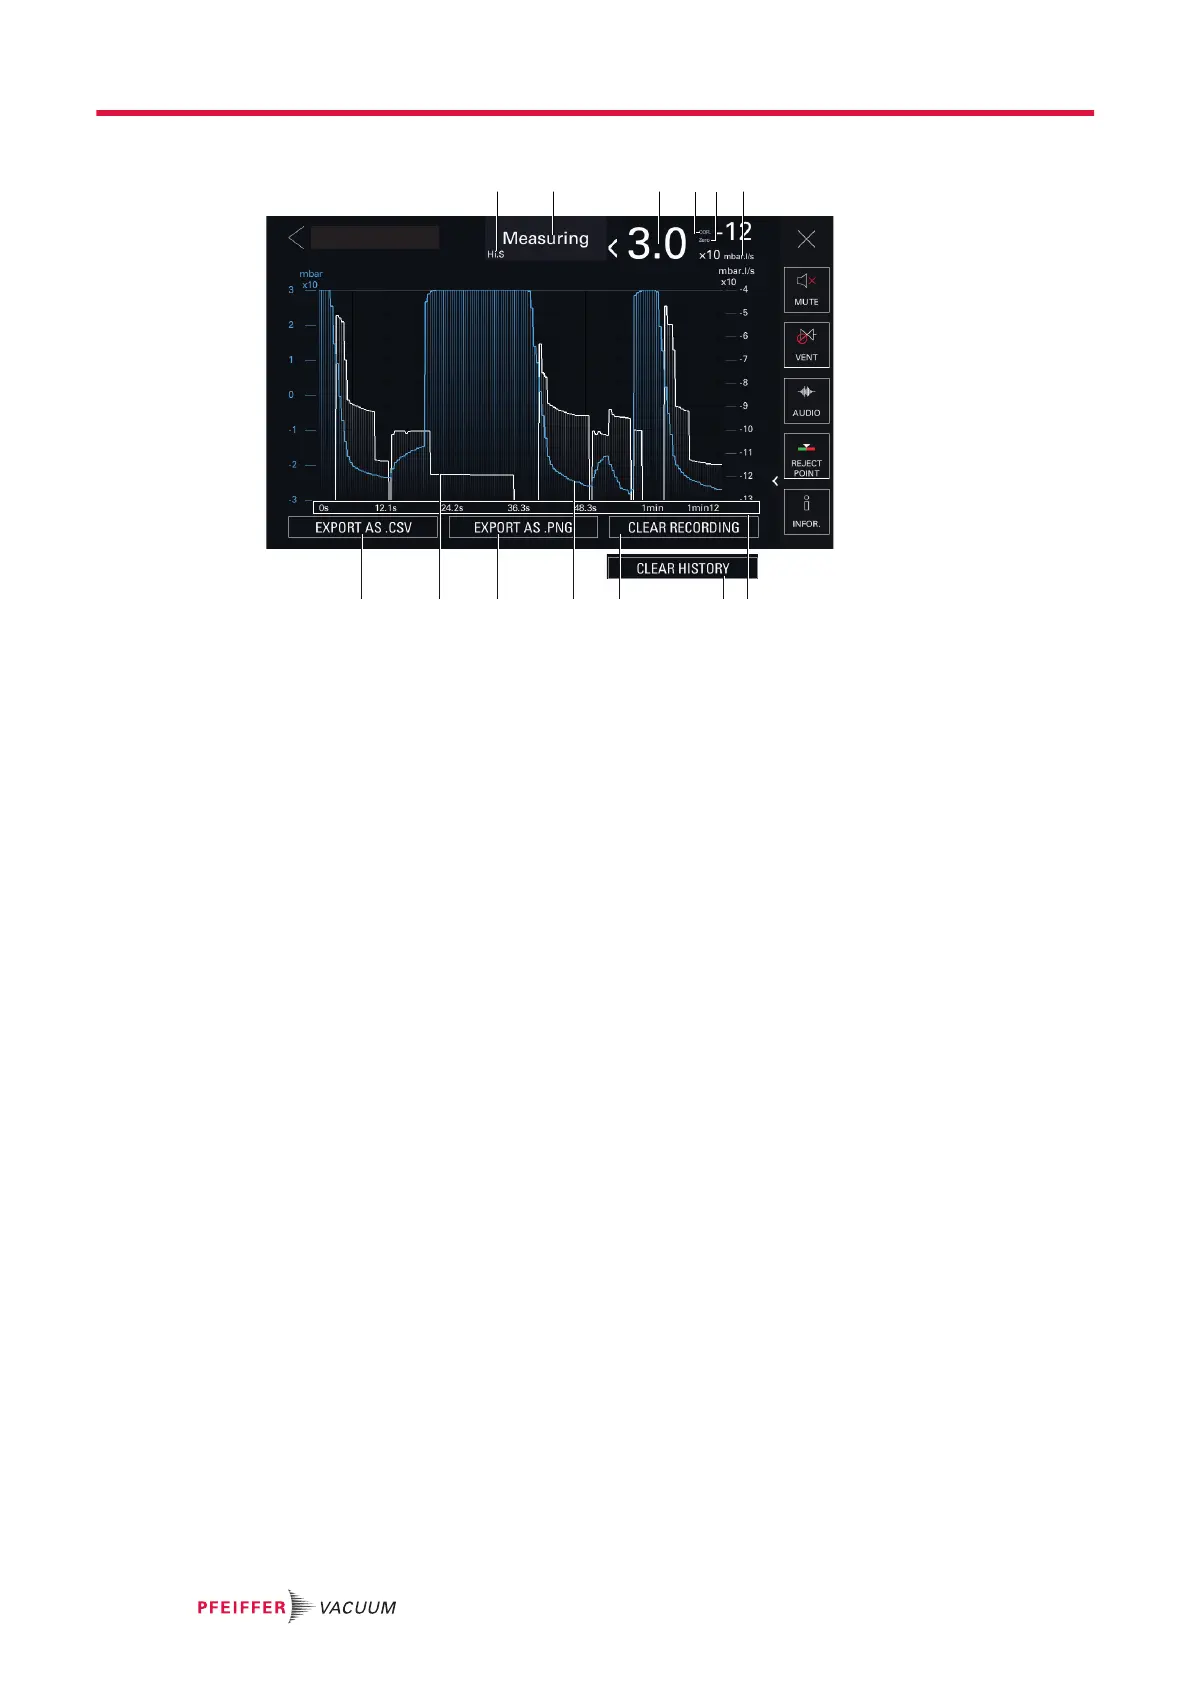
Graph
13 12 1011 9 8 7
63 4 521
XXXXXXXXXX
1 Test mode selected 8 Button to delete the graph history
2 Current status of the detector 9 Button to clear the recording in progress
3 Leak rate digital display 10 Inlet pressure plot (blue)
4 COR indicator: correction factor applied 11 Button to save a .png screenshot
5 Zero indicator: zero function applied 12 Leak rate plot (white)
6 Leak rate unit 13 Button to save a .csv file
7 Total recording time
Operation
36/98