Interrupts/diagnostic alarms
14.4 Diagnostics response
Analog input module AI Energy Meter 480VAC/CT HF (6ES7134-6PA00-0CU0)
Manual, 07/2018, A5E42674880-AA
115
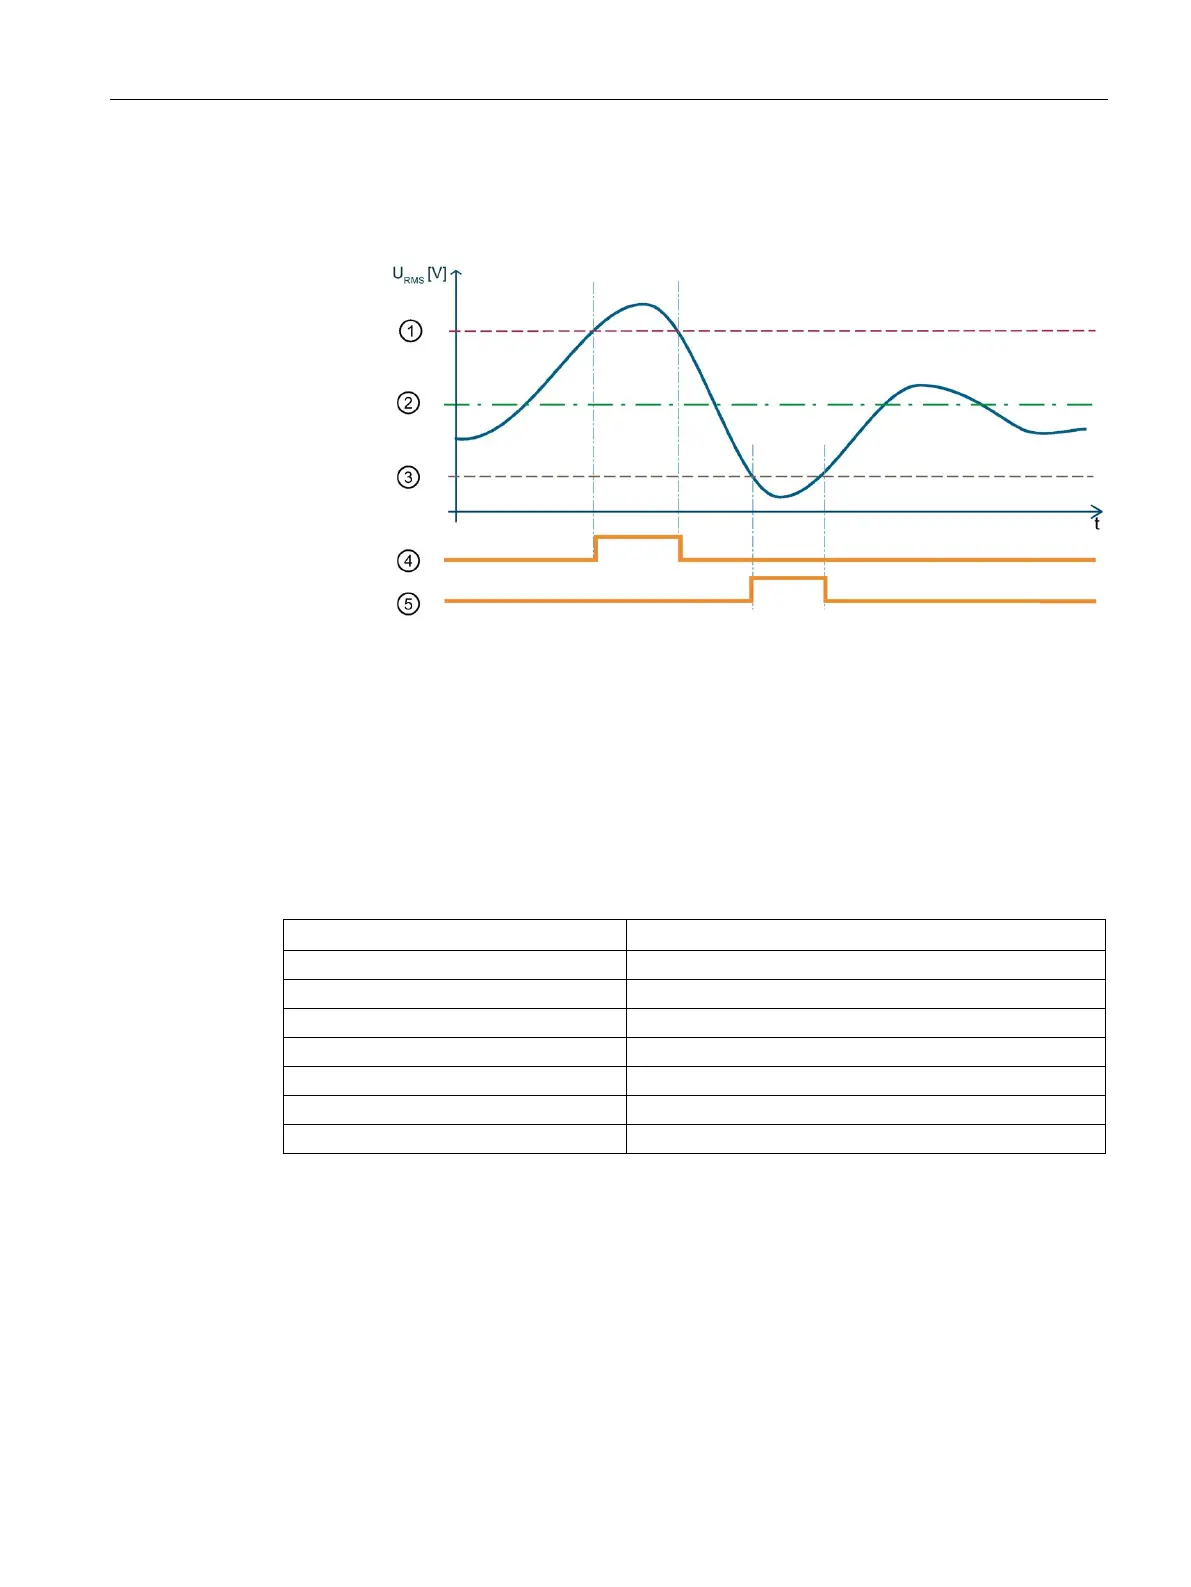
The following figure is a schematic diagram of the principle of operation:
Upper tolerance value measuring voltage
Lower tolerance value measuring voltage
Figure 14-3 "Overflow/Underflow" diagnostics of the effective voltage value
The following table shows the parameter assignment for the example:
Table 14- 7 Parameter assignment
Power quality analysis functions
Voltage transformer primary voltage
Voltage transformer secondary voltage
Tolerance factor overflow/underflow
In this example you define a tolerance range of ± 20%. The tolerance range corresponds to
an effective value of primary voltage of ± 46 V.
In the figure the effective value of the primary voltage first exceeds the tolerance range. As
long as the effective value of the primary voltage exceeds the tolerance range the module
reports the diagnostics "overflow".
The effective value of the primary voltage then exceeds the tolerance range. As long as the
effective value of the primary voltage exceeds the tolerance range the module reports the
diagnostics "underflow".