CALIBRATION & ADJUSTMENT
5-4
SIG-QG-20-02 JANUARY 2021
Version : A.2
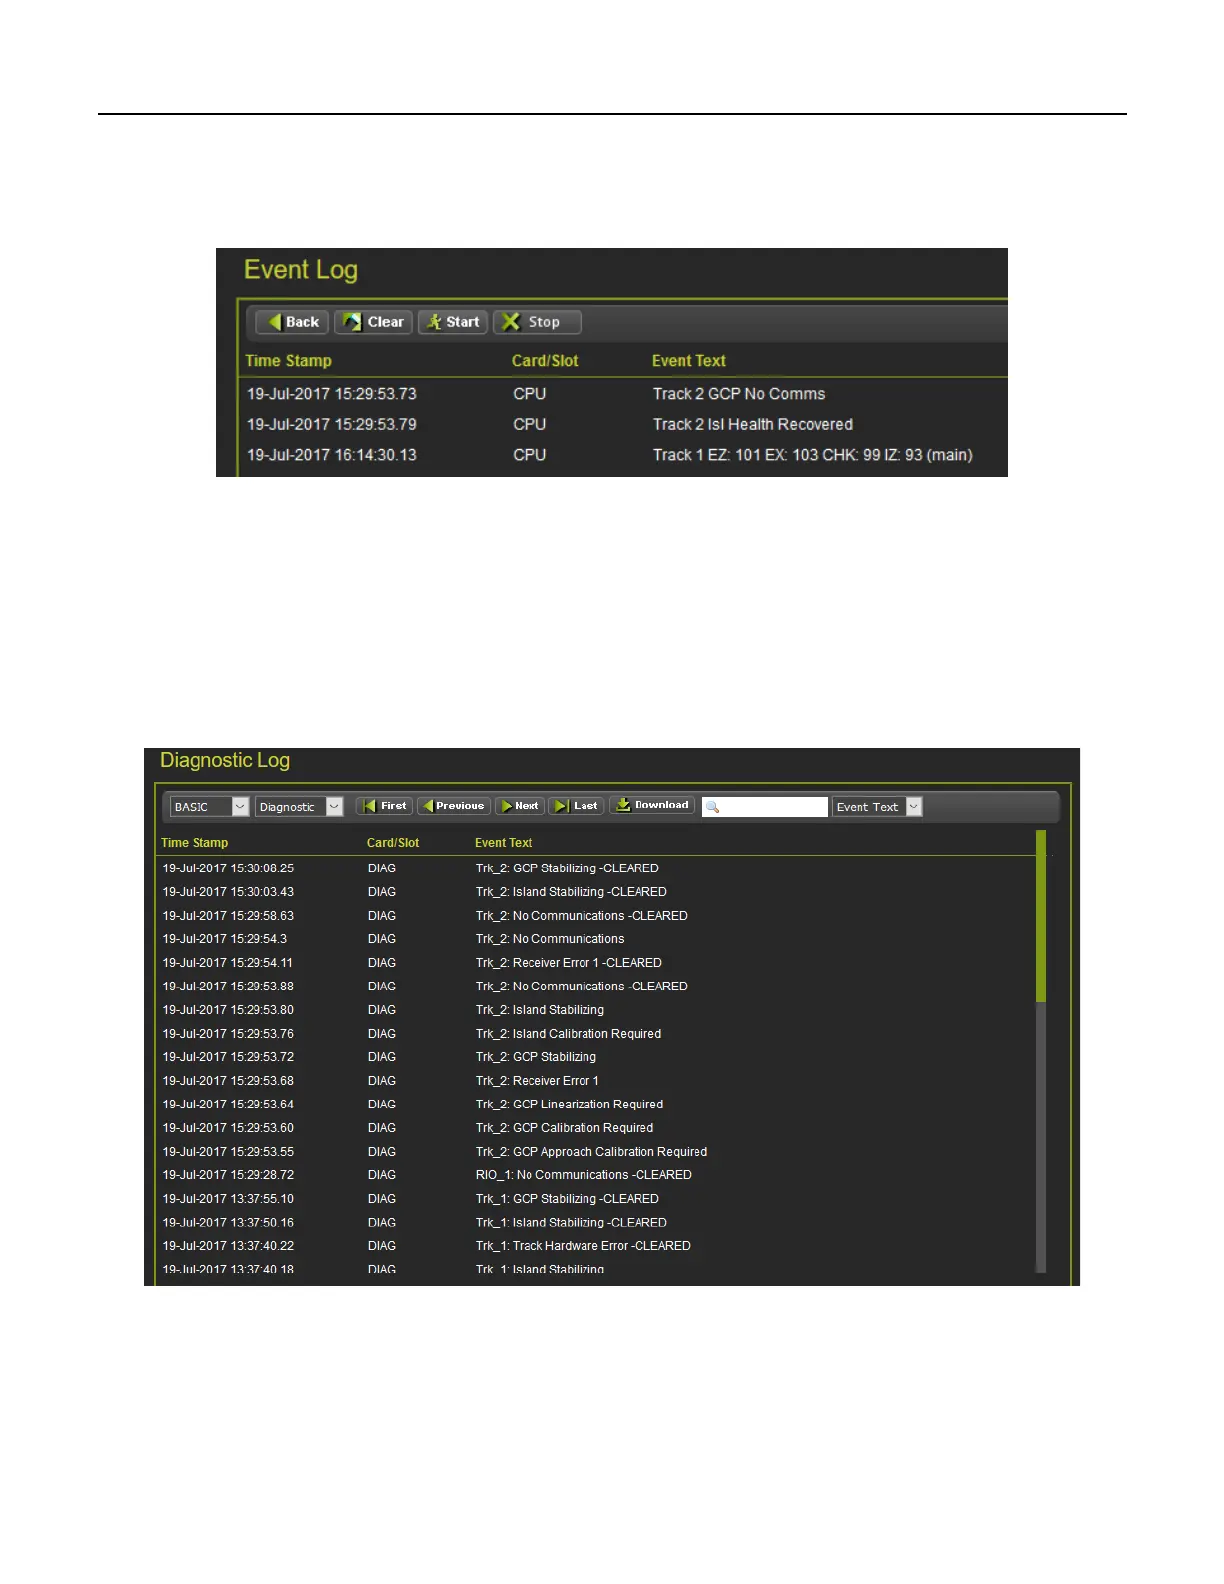
If TRACE is selected, the WebUI will go into Trace mode and add events to a text buffer as they are
received in real time. To pause the trace, press the Stop button. To restart tracing, press the Start again.
To clear the trace buffer press the Clear button. Press the back button to exit TRACE mode and return to
the BASIC mode.
Figure 5-7 WebUI Event Log TRACE Mode
5.2 DIAGNOSTIC LOG
The Diagnostic log contains entries for whenever a diagnostic message is generated or cleared. The
events in here are generated by the CPU and sent to the display where they are time stamped and
added to the log. In a redundant system, the Display log will contain events from both the main and
standby systems.
The WebUI diagnostic log page allows the user to page through the events, download all or part of the
log, or turn on a real time trace so new events get display as they are logged.
Figure 5-8 WebUI Diagnostic Log
The menu bar allows navigation of the log and downloading is the same as for the Event Log.