B
A
D
C
9-2 Interpreting the display
The echosounder windows do not show a xed distance
travelled by the boat; rather, they display a history,
showing what has passed below the boat during a certain
period of time.
The history of the echosounder signal shown depends
the depth of the water and the scroll speed setting.
In shallow water, the echoes have a short distance to
travel between the bottom and the boat. In deep water,
the history moves across the window more slowly
because the echoes take longer to travel between the
bottom and the boat. For example, when the scroll speed
is set to
Fast, at depths over 1000 ft (300 m) it takes
about 2 minutes for the data to move across the window,
whereas at 20 ft (6 m) it takes only about 25 seconds.
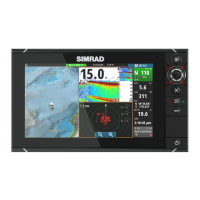
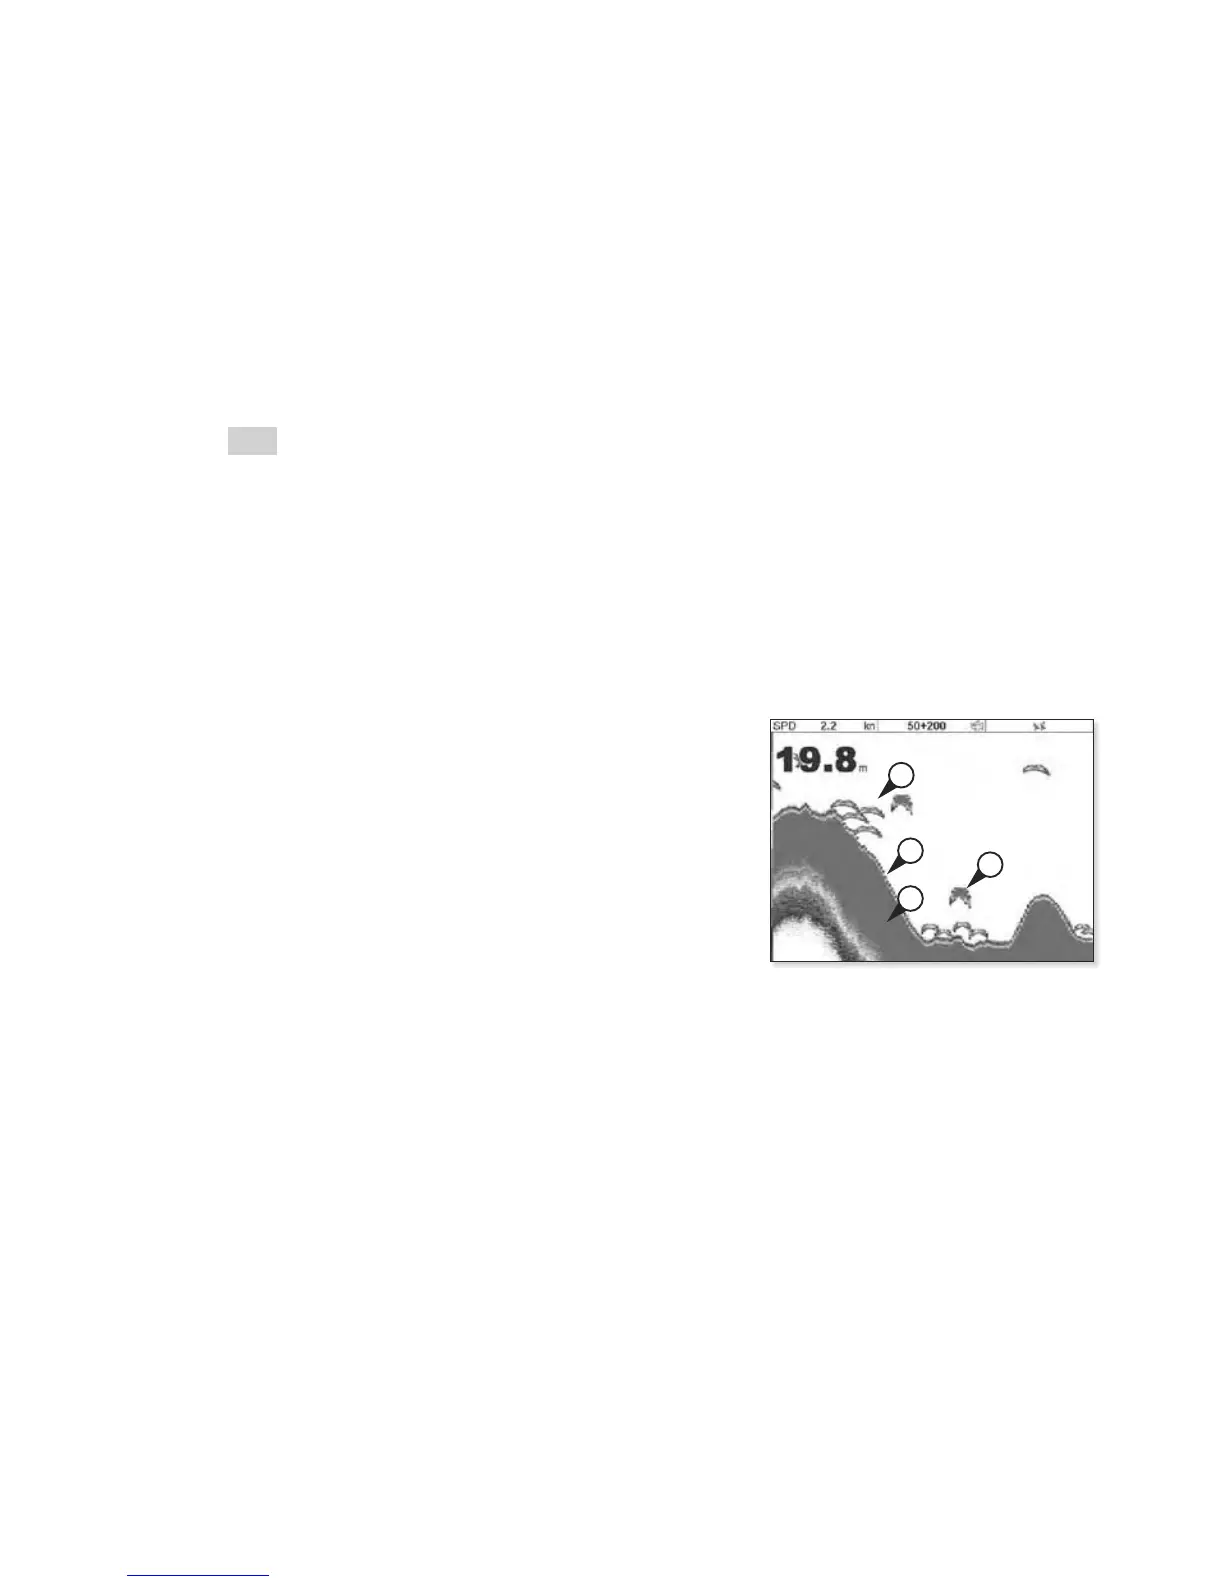
A School of sh
B Single sh
C Hard bottoms such as rock and coral show as wide
bands
D Soft bottoms such as mud, weed and sand show as
narrow bands
The scroll speed can be set by the user to display either
a longer history with less sh information or a shorter
history with more sh details.
If the boat is anchored, the echoes all come from the
same area of bottom. This produces a at bottom trace
on the window.
The screen shot shows a typical echosounder window
with the Fish symbols turned Off. The echosounder pulse
generated by the unit transducer travels down through
the water, spreading outwards in a cone shape. The cone
width is dependent upon the frequency of the pulse;
at 50 kHz it is approximately 45°, and at 200 kHz it is
approximately 11°.
The differences in the cone width affect what is shown.
Strength of echoes
The colors indicate differences in the strength of the
echo. The strength varies with several factors, such as
the:
Size of the sh, school of sh or other object.•
Depth of the sh or object.•
Location of the sh or object. (The area covered by •
the ultrasonic pulse is a rough cone shape and the
echoes are strongest in the middle.)