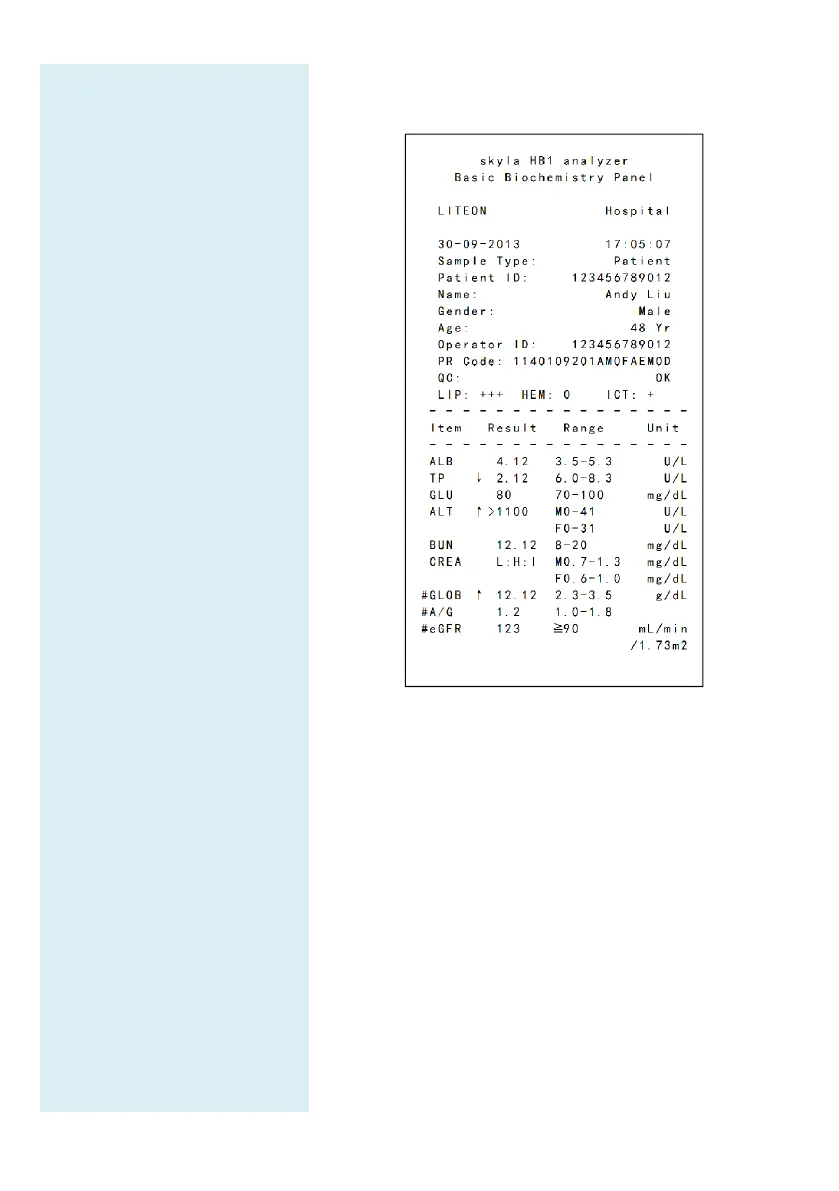
3-12
Symbols used in test reports:
(#): Calculated value
(
↑
):Result is higher
than referance range.
(
↓
):Result is lower
than referance range.
(>): Result is greater than
the highest value of the
dynamic range.
(<):Result is less than the
lowest value of the
dynamic range.
(+): Degree of lipemia,
hemolysis, or icterus.
LIP: Lipemia
HEM: Hemolysis
ICT: Icterus
Severity:
“0” (Clear)
“+” (Mild)
“++” (Moderate)
“+++” (Severe)
(L): Lipemia interference
effect is outside the
permissible range by 10%
or more. “L:_:_” is shown.
(H) Hemolysis interference
effect is outside the
permissible range by 10%
or more. “_:H:_” is shown.
Table 1: Test report generated when the QC Report
function is not used
3.7.1 Symbols Used in Test Reports
(#): Calculated value.
(↑):Result is higher than referance range.
(↓):Result is lower than referance range.
If the result is outside the dynamic range of
marker, a “less than” symbol (<) will be displayed
to the lowest value or a
“greater than” symbol (>) will
be displayed next to the highest value
the result where the marker is less than
value or greater than the highest value of the
range of the marker. For example,
of glucose is 10–600 mg/dL.
concentration is less than this range, “<10 mg/dL
be shown; if
it is greater than this range, “>600