158
Data Manager Operations Scanner DataViewer Operation
Tools Menu
The Tools menu opens the Properties dialog box.
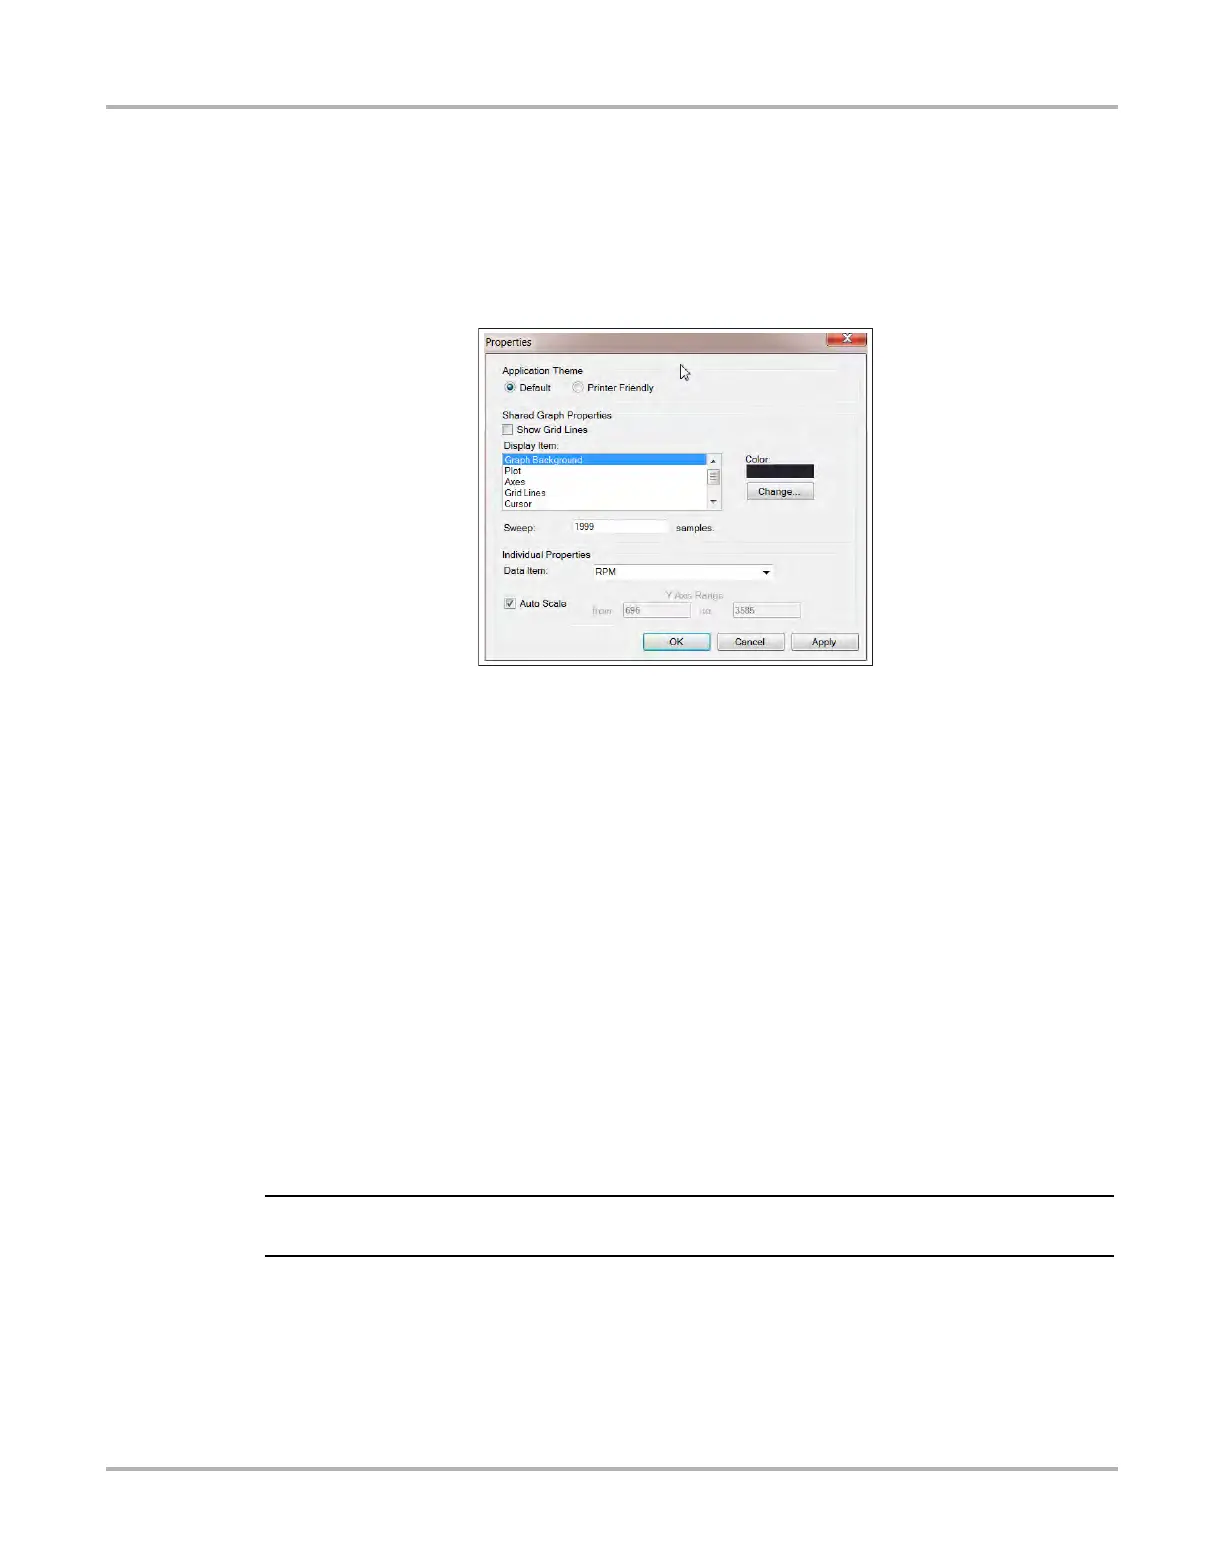
The Properties dialog box has two sections (Figure 12-22); Shared Graph Properties and
Individual Properties. Shared Graph Properties apply to all graphs and Individual Properties apply
to the selected graph only.
Figure 12-22 Properties dialog box
Properties dialog box selections include:
• Grid Lines—when selected, a line displays at each major division of the graphs.
• Display Item—use to view the display color of the listed items. Highlight an item and the
current color appears in the Color box.
• Change—use to change the color of the highlighted item, select to open a color palate.
• Sweep—use to adjust the number of data frames that appear on the screen (zoom in or out),
highlight and type in the desired number.
• Reset Colors—use to restore the default color settings.
• Data Item—use this pulldown menu to select individual graphs for modification.
• Auto Scale—minimum and maximum (Y axis) values automatically adjust to the signal when
the box is checked, uncheck the box if you want to custom set the values.
• Y Axis Range—use to type desired minimum (from) and maximum (to) values in the selection
boxes. This field is only active when Auto Scale is deselected.
• OK—applies the changes and closes the properties dialog box.
• Cancel—closes the properties dialog box without making changes.
• Apply—applies the changes and leaves the properties dialog box open.
i The Properties icon on each graph also opens the Properties dialog box (Figure 12-18).
 Loading...