68
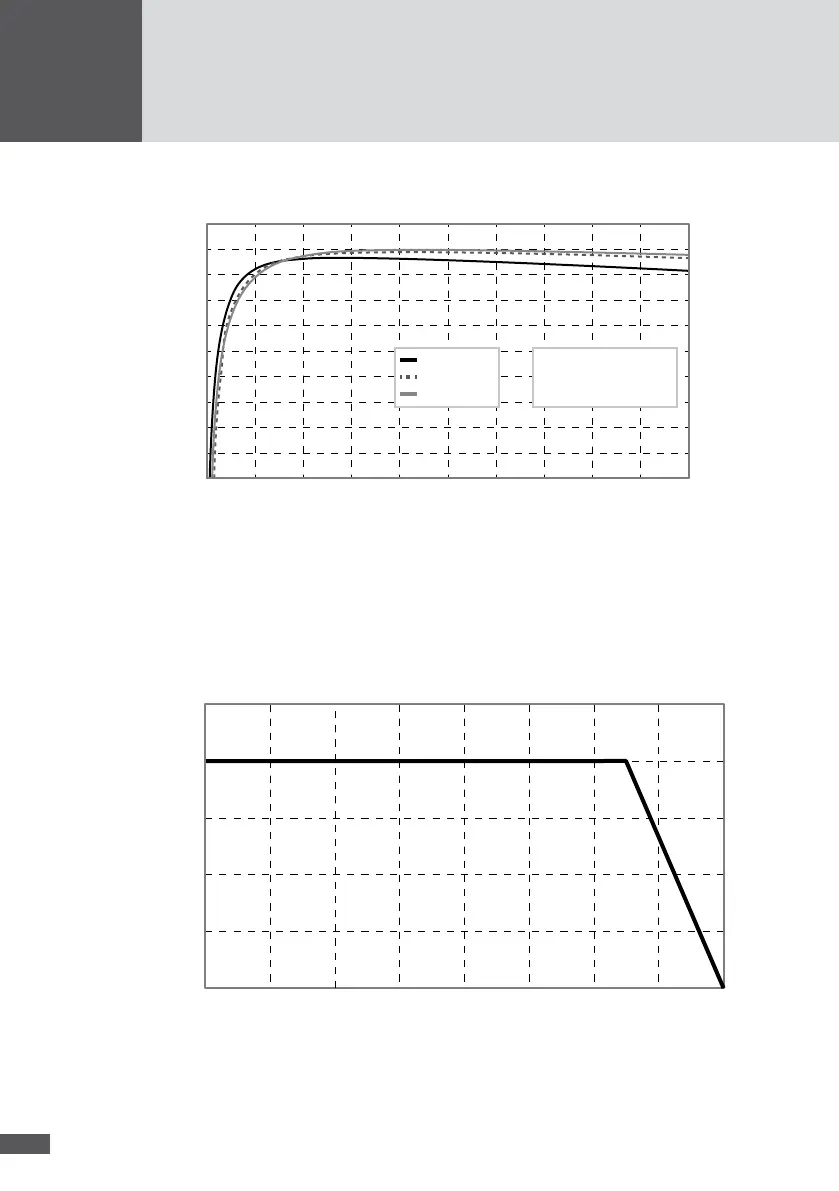
11�1 Efciency curve
0 10 20 30 40 50 60 70 80 90 100
82
80
86
88
90
92
94
96
98
100
84
U
DC
=720 V
U
DC
=580 V
U
DC
=460 V
η
Euro
(720 V) = 97.5%
η
Euro
(580 V) = 97.5 %
η
Euro
(460 V) = 97.0 %
Rated output power [%]
Efciency η [%]
Figure 45 Efficiency curve - SolarMax HT series
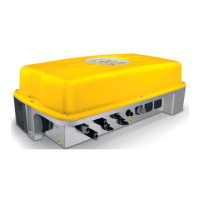
11�2 Temperature-dependent output reduction
When the ambient temperature is too high, the inverter reduces its output as illustrated
in Figure 46 (power derating).
100
75
50
25
0
−20 −10 0 10 20 30 40 45 50 60
Output Pac/Pac nom [%]
Ambient temperature [°C]
Figure 46 Power derating - SolarMax HT series