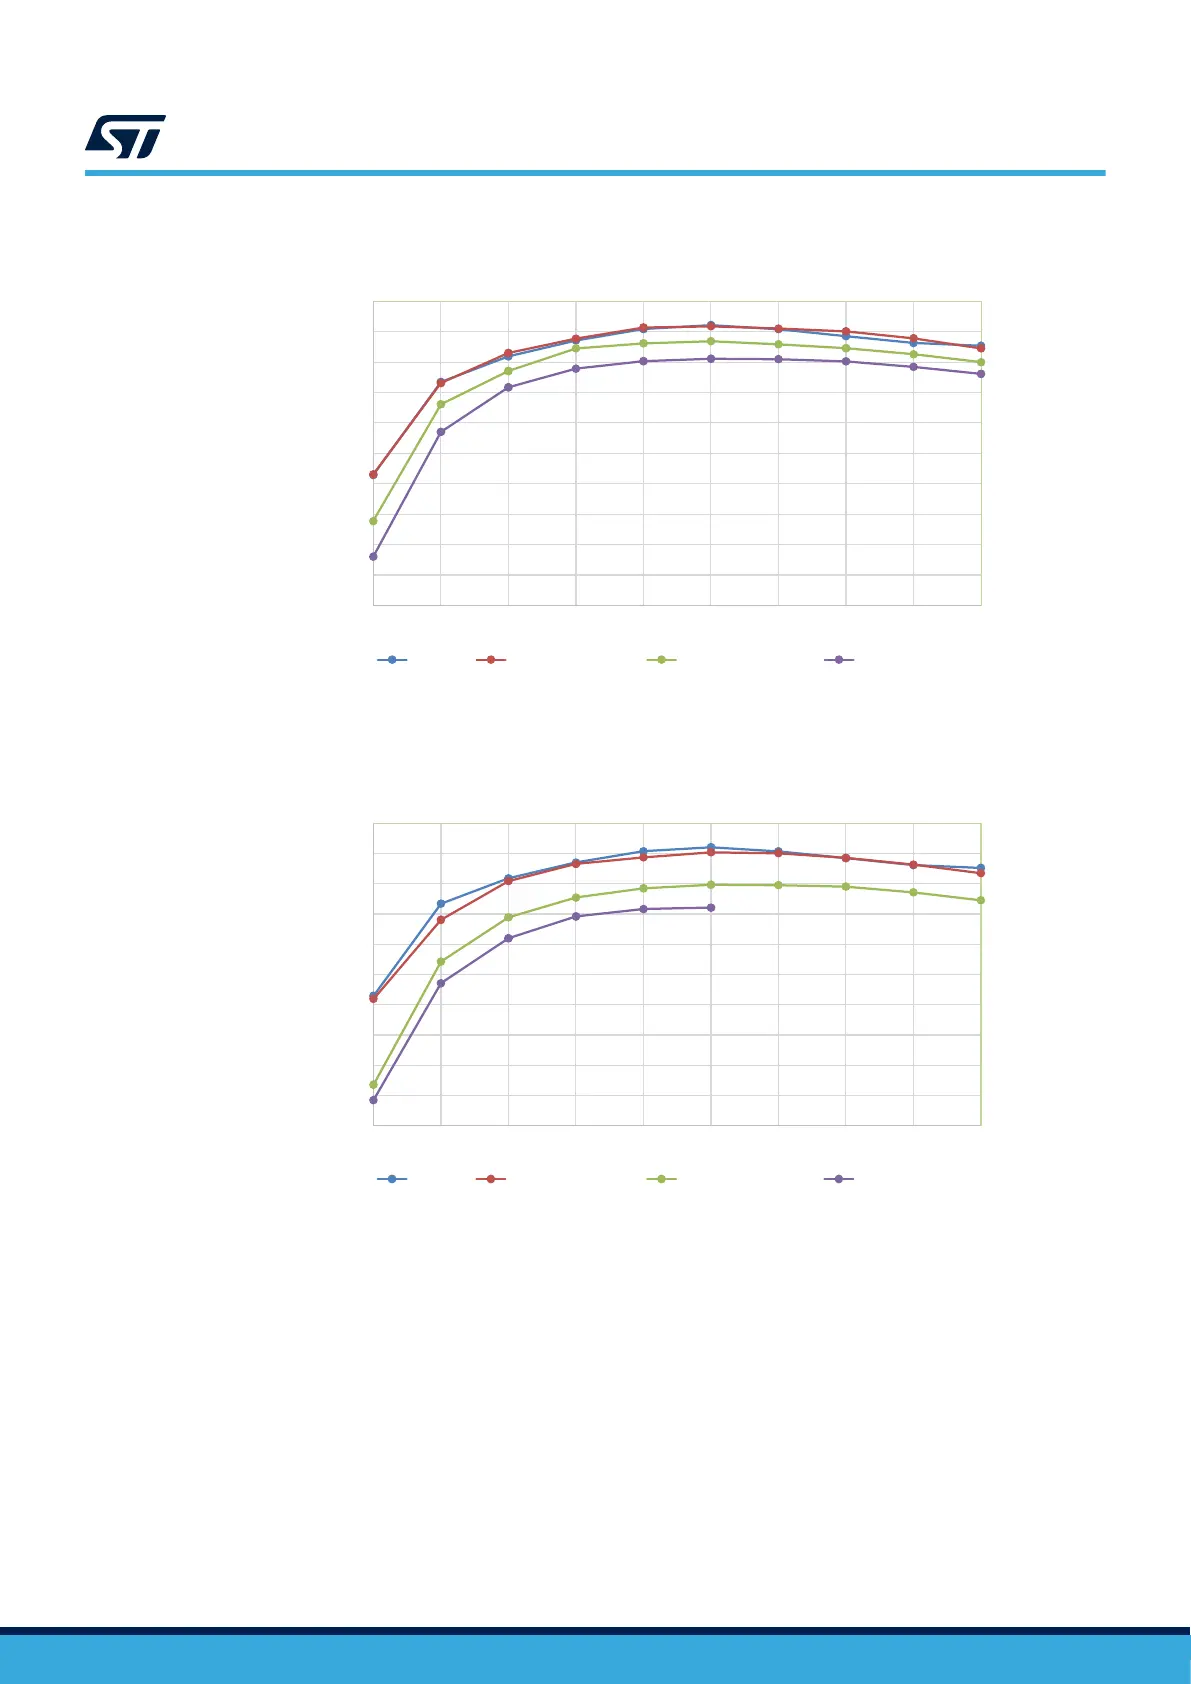
Figure 61. Efficiency curve in X axis
35%
40%
45%
50%
55%
60%
65%
70%
75%
80%
85%
0.1 0.2 0.3 0.4 0.5 0.6 0.7 0.8 0.9 1
Efficiency [%]
Iout [A]
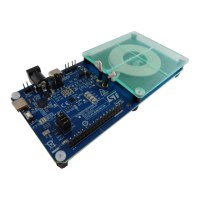
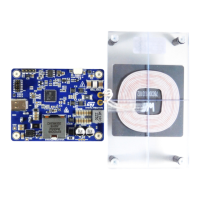
STEVAL-WBC86TX + STEVAL-WLC38RX (X-axis)
Center 5 mm misalignment 10 mm misalignment 12 mm misalignment
Figure 62. Efficiency curve in Y axis
35%
40%
45%
50%
55%
60%
65%
70%
75%
80%
85%
0.1 0.2 0.3 0.4 0.5 0.6 0.7 0.8 0.9 1
Efficiency [%]
Iout [A]
STEVAL-WBC86TX + STEVAL-WLC38RX (Y-axis)
Center 5 mm misalignment 10 mm misalignment 12 mm misalignment
5.2.3 Efficiency and spatial freedom in the Z-axis
Z-axis distance between the coils, also known as charging gap, is an additional parameter that significantly affects
charging performance. Therefore, the STEVAL-WBC86TX was also tested at various charging gap distances.
Efficiency curves for various misalignments in the Z-axis are shown in the figure below:
UM3161
Typical performance characteristics
UM3161 - Rev 1
page 48/78