List of figures
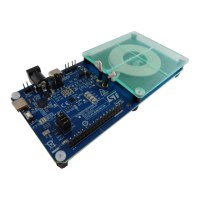
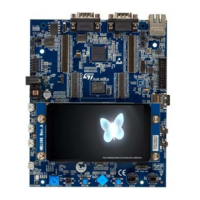
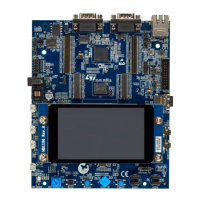
Figure 1. STEVAL-WBC86TX board ............................................................1
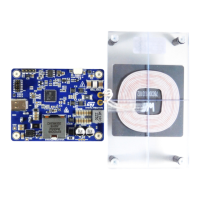
Figure 2. STEVAL-WBC86TX evaluation board features ..............................................4
Figure 3. Connectors and test points............................................................5
Figure 4. GUI connection....................................................................7
Figure 5. GUI device connection...............................................................8
Figure 6. Generation of configuration file .........................................................9
Figure 7. Version of the configuration file .........................................................9
Figure 8. Saving of the configuration file ........................................................10
Figure 9. Header generator - chip selection ...................................................... 11
Figure 10. Header generation - pop up window .................................................... 11
Figure 11. Header generation - save header file .................................................... 12
Figure 12. Programming the device by header file .................................................. 13
Figure 13. Generating the header file by patch and configuration files ..................................... 14
Figure 14. System block diagram ..............................................................15
Figure 15. H-bridge mode settings ............................................................. 16
Figure 16. GUI charts monitoring .............................................................. 16
Figure 17. OCP settings .................................................................... 18
Figure 18. OVP settings .................................................................... 18
Figure 19. OVTP settings ................................................................... 19
Figure 20. NTC connection on board ...........................................................20
Figure 21. NTC settings .................................................................... 20
Figure 22. Disable FO detection ............................................................... 21
Figure 23. Add a new dataset ................................................................ 22
Figure 24. Display dataset in plot .............................................................. 22
Figure 25. Enable auto scroll .................................................................22
Figure 26. Additional dataset options ........................................................... 23
Figure 27. Line properties - dashed/solid ........................................................ 23
Figure 28. Line properties - color .............................................................. 23
Figure 29. Logged data..................................................................... 24
Figure 30. Delete a single data point............................................................25
Figure 31. Spot wrong data point in plot ......................................................... 25
Figure 32. Plot logged data .................................................................. 26
Figure 33. Ploss threshold...................................................................27
Figure 34. CTC threshold ................................................................... 27
Figure 35. Unsutiable parameter values highlighted in red ............................................. 28
Figure 36. Load tuned parameters ............................................................. 29
Figure 37. Enable FOD and set FOD debounce .................................................... 29
Figure 38. EPT reason ..................................................................... 30
Figure 39. Received message ................................................................31
Figure 40. EPT interrupt setting ............................................................... 31
Figure 41. Protection debounce setting .......................................................... 32
Figure 42. EPT reping settings................................................................32
Figure 43. Power transfer start up sequence ...................................................... 33
Figure 44. Amplitude modulation of the Power Signal ................................................ 35
Figure 45. Example of a differential bi-phase encoding scheme ......................................... 36
Figure 46. Example of the asynchronous serial format ...............................................36
Figure 47. ASK communication example - high load current............................................ 36
Figure 48. ASK communication - no load......................................................... 37
Figure 49. Example of differential bi-phase encoding ................................................ 37
Figure 50. Format of the three defined responses...................................................38
Figure 51. Writing to a single register ........................................................... 40
Figure 52. Writing to multiple registers ..........................................................40
Figure 53. Reading from a single register ........................................................ 40
UM3161
List of figures
UM3161 - Rev 1
page 76/78