72
Operation SeaBat Sonar UI - User Manual
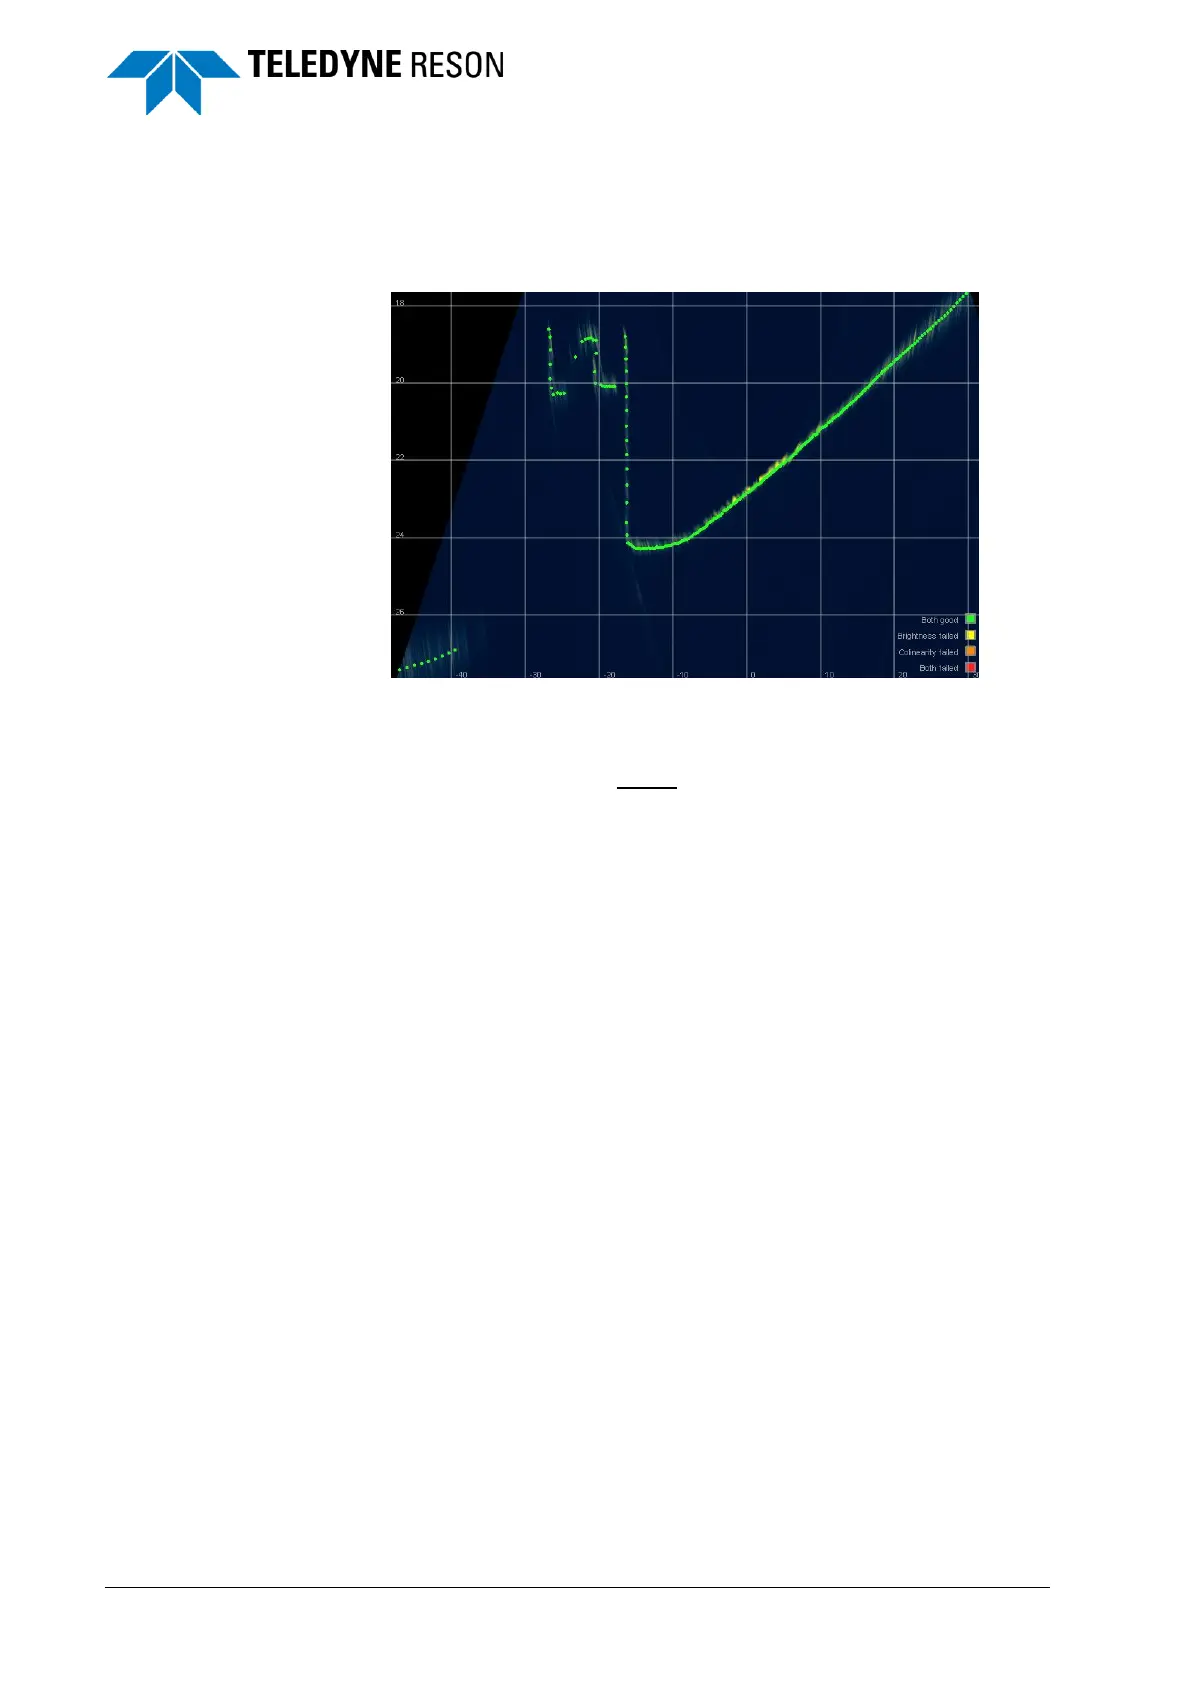
4.11.6 Detect
The Detect screen shows the bathymetry data of a single swath with
different beam data color modes. The swath is displayed in Zoom Extent
mode; the vertical scale is enlarged to enhance the details of the swath.
Figure 4-90 Detect screen with one swath
The legend for the multibeam data color mode(Fixed, Quality, Detection
Process and Uncertainty) is shown in the lower right corner of the screen.
This legend (Data Layer) cannot be switched off in the Display.
The grid lines (Grid Layer) can be switched on/off in the Display pane
(see Figure 4-49).
4.11.7 Sidescan
The Sidescan screen shows an image of the seafloor which can be used
to locate and identify features and bottom conditions. Each sonar ping is
used to generate a line of data. Each line contains a series of amplitudes
representing the signal return versus time or range. When a series of
these lines is combined and displayed as the vessel moves along the
track, a two-dimensional image is formed, providing a detailed picture of
the bottom along either side of the vessel.
The sidescan data can be viewed on a waterfall display representing the
results of a peak-detect search through the left and right beams of the
swath.