5-3
Running a Case
Single-Parameter GraphsSingle-Parameter Graphs
Any parameter displayed in Measurement Mode can be tapped to view a graph of that
parameter. This graph includes all marked events.
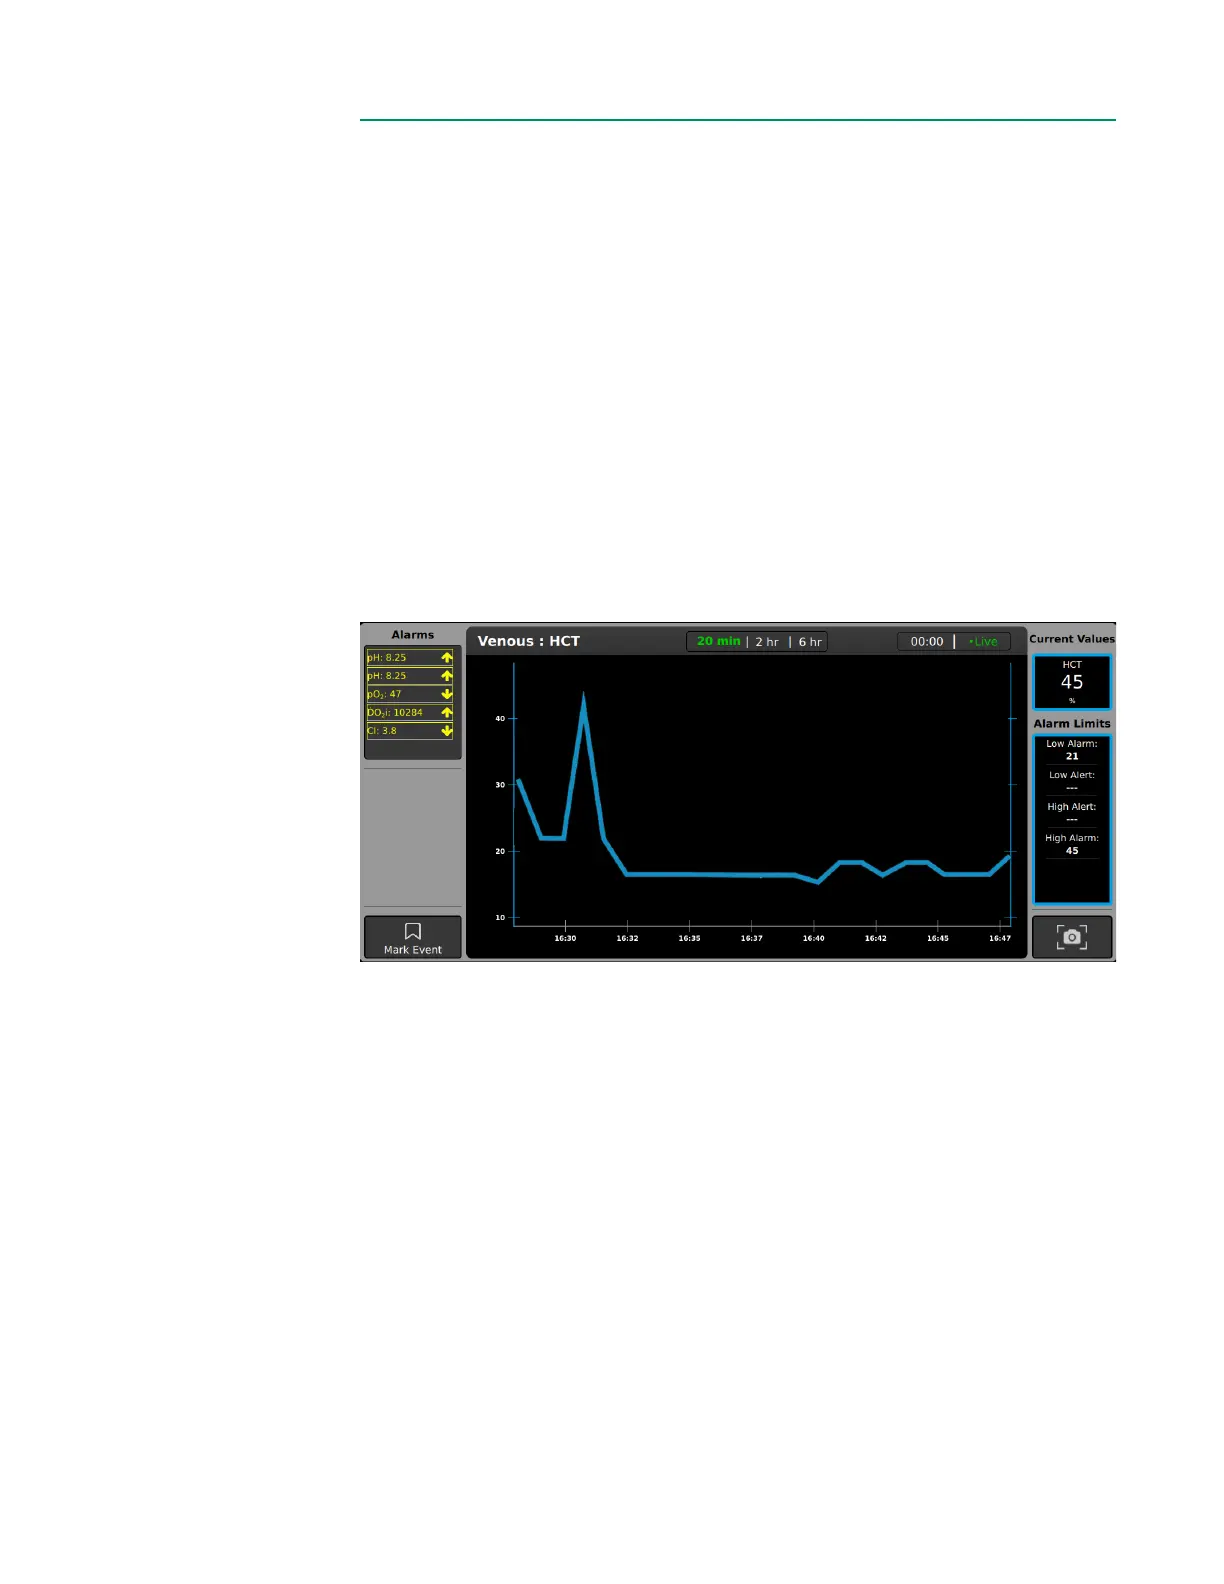
• The current parameter’s value and alert/alarm limits are shown on the right.
All active alerts/alarms are shown on the left.
• Tap the top of the graph to toggle between time ranges of 20 minutes, 2 hours and
6 hours of data for that parameter.
• Press, hold and drag anywhere on the graph to view previous data.
• The upper right shows either the time offset (in minutes : seconds) or Live
highlighted in green. If the graph is displaying current data for the parameter, then
Live will be highlighted in green. If the graph is at an offset, Live can be tapped to
return to displaying current data.
See image below for an example of a single-parameter graph set to a time range of
20 minutes displaying live data: