3-125
■
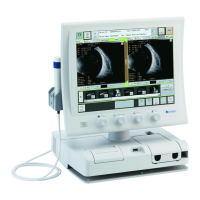
3.5.3 Checking waveforms after measurement
a) Displaying the optional waveform data
1) When all necessary measurement data is captured or when the “Edit
Window” button (1) is touched, the edit screen (Fig. 2) opens.
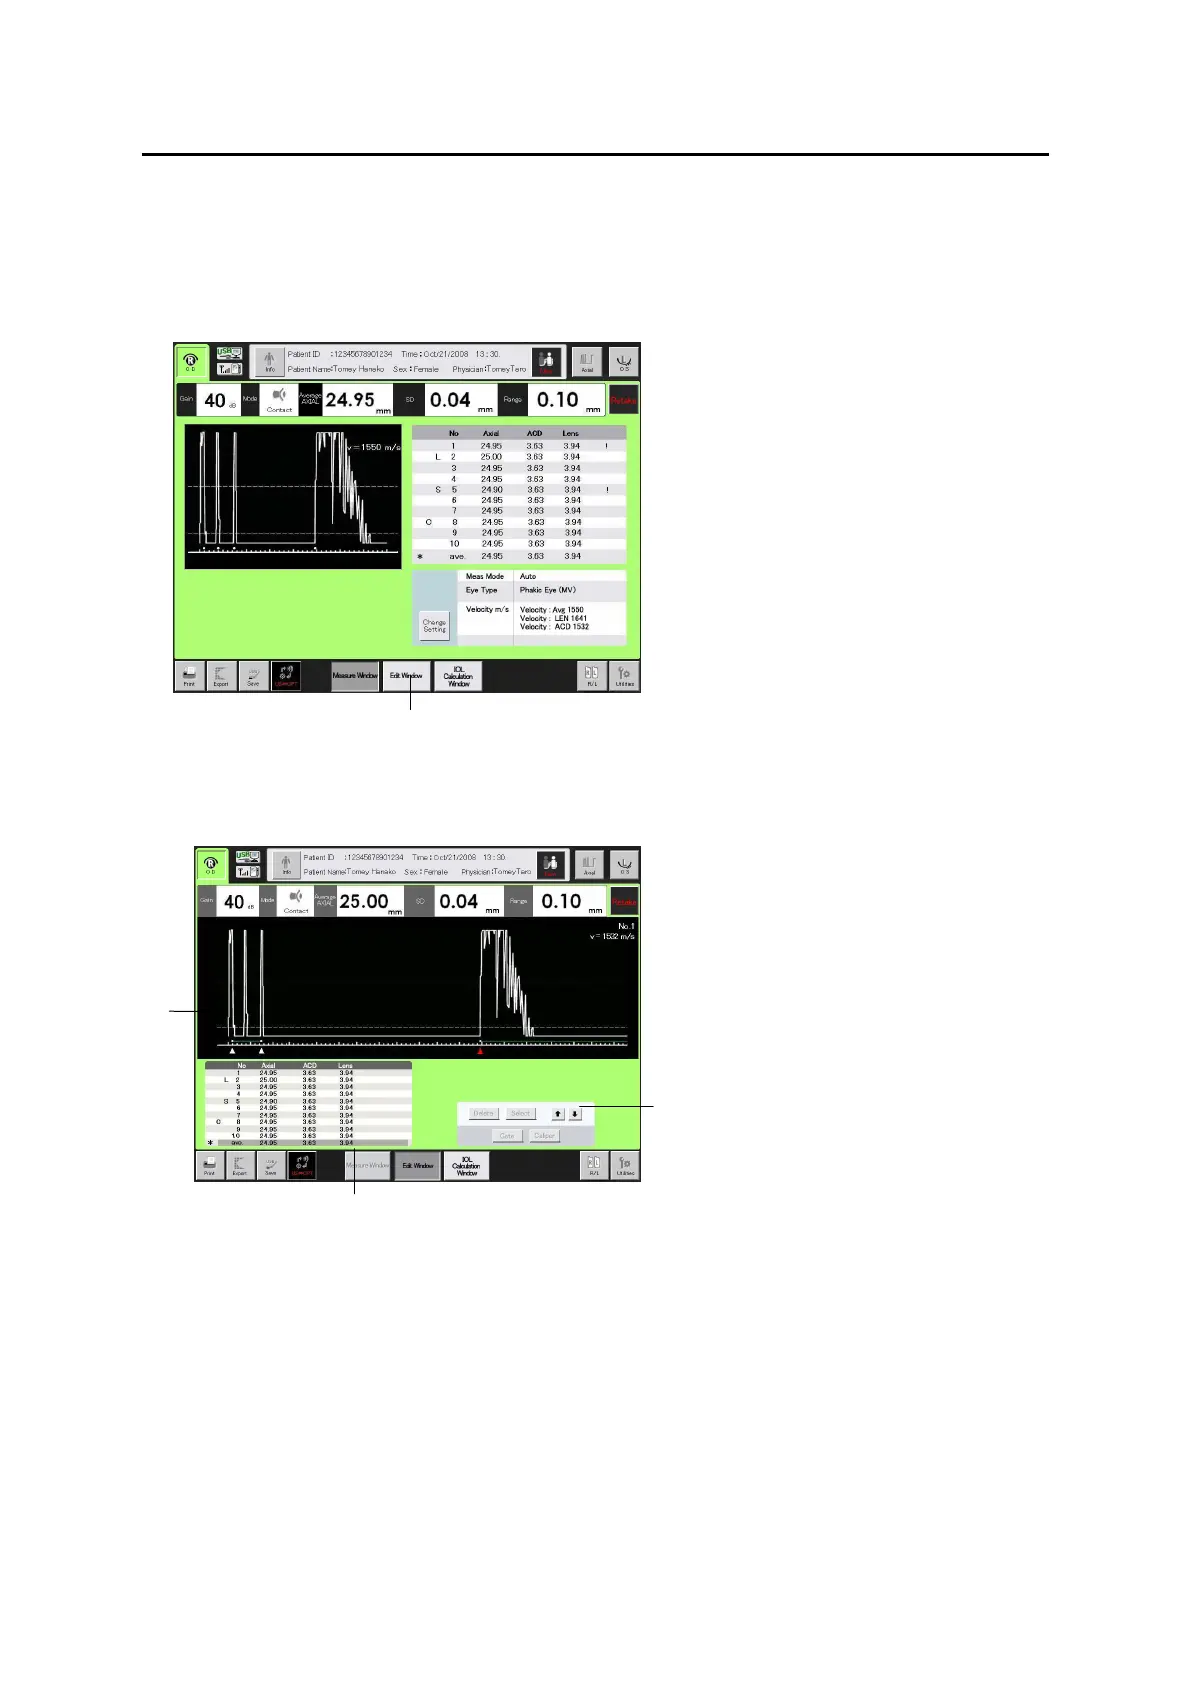
2) The waveform measured at the selected cursor (2) is displayed in the
waveform display field (3). When “Avg” is selected, the waveform of the
data number whose measurement is the closest to the average value is
displayed. Touch the selection cursor movement buttons (4) to move the
selection cursor (2) up or down.
3-35
(Fig. 1)
(1)
3-89
(Fig. 2)
(2)
(4)
(3)
 Loading...