5: Viewing your Studies in DMS
Viewing Data and Data Finder Page
Viewing Data and Data Finder Page
When you download the data via the the download feature, the data is stored and viewable via the
data finder page with advanced charting, tables, and reporting capability. The information is viewable
in customizable graphs and/or with measurements/parameters displayed on the top navigational bar.
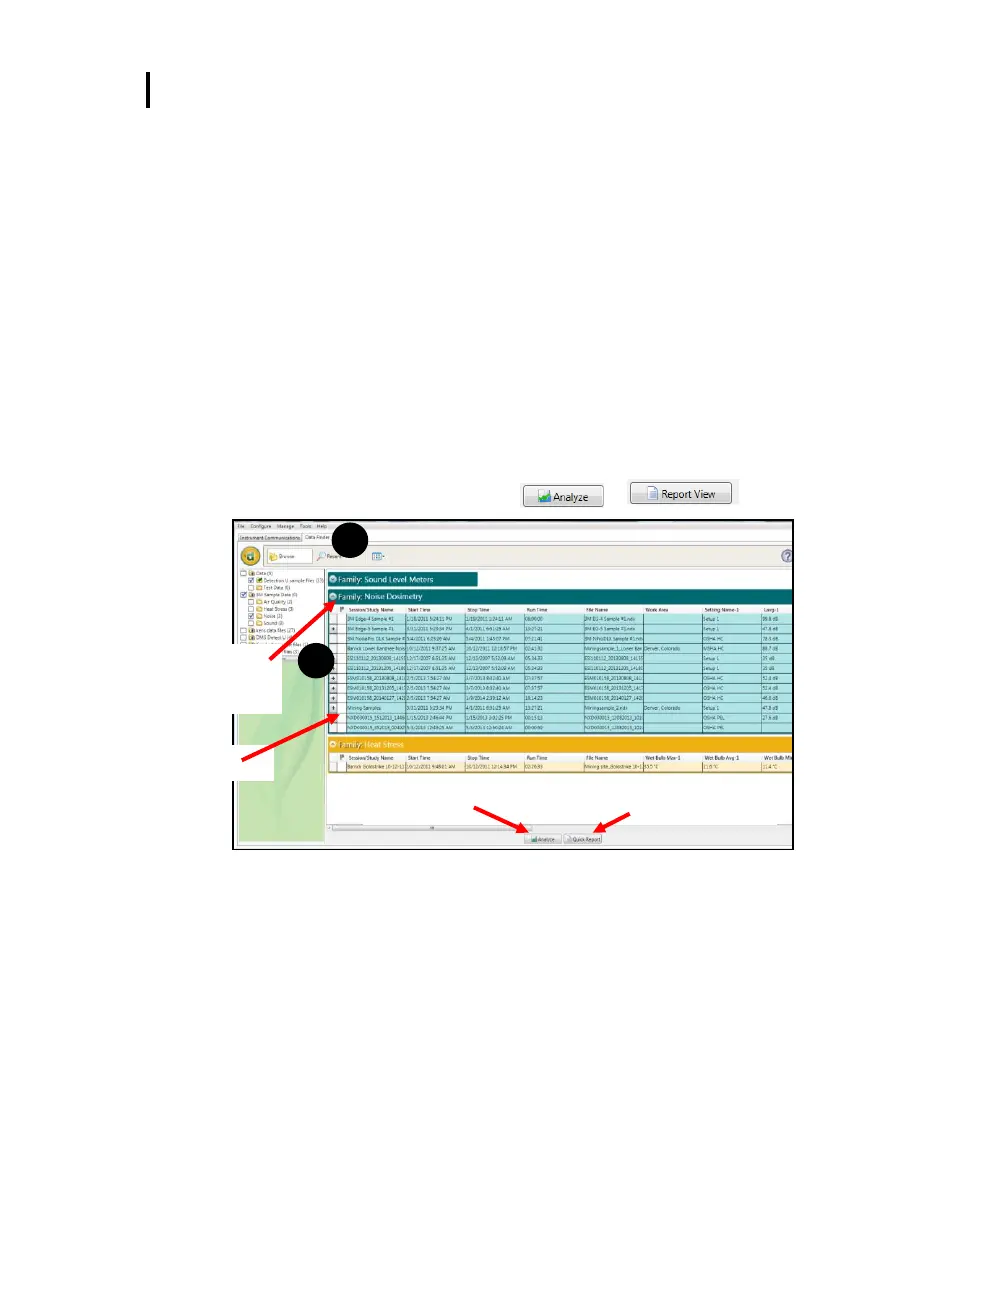
Selecting and viewing data
1. In the Data Finder page (see 1), select the Noise Dosimetry data (see 2) by clicking on either
the session or study (Note: You may need to expand to see the study data.)
Once selected, it will appear with a blue shading.
2. Optional: To reorganize the data displayed in the data finder columns, click drag and drop the
titles of the columns in different positions. To shrink/expand the columns, click and drag the
black column divider(s). (Note: These methods are similar to positioning/expanding in Microsoft
®
Excel
®
spreadsheet program.)
3. To view in Charts and Tables, click on or buttons.
Figure 5-4: Data Finder page with the downloaded data
Data headings (optional: drag/
drop and/or shrink/expand
columns to reorganize table)
 Loading...