5: Viewing your Studies in DMS
Panel Layout View(charts/tables)
Panel Layout View(charts/tables)
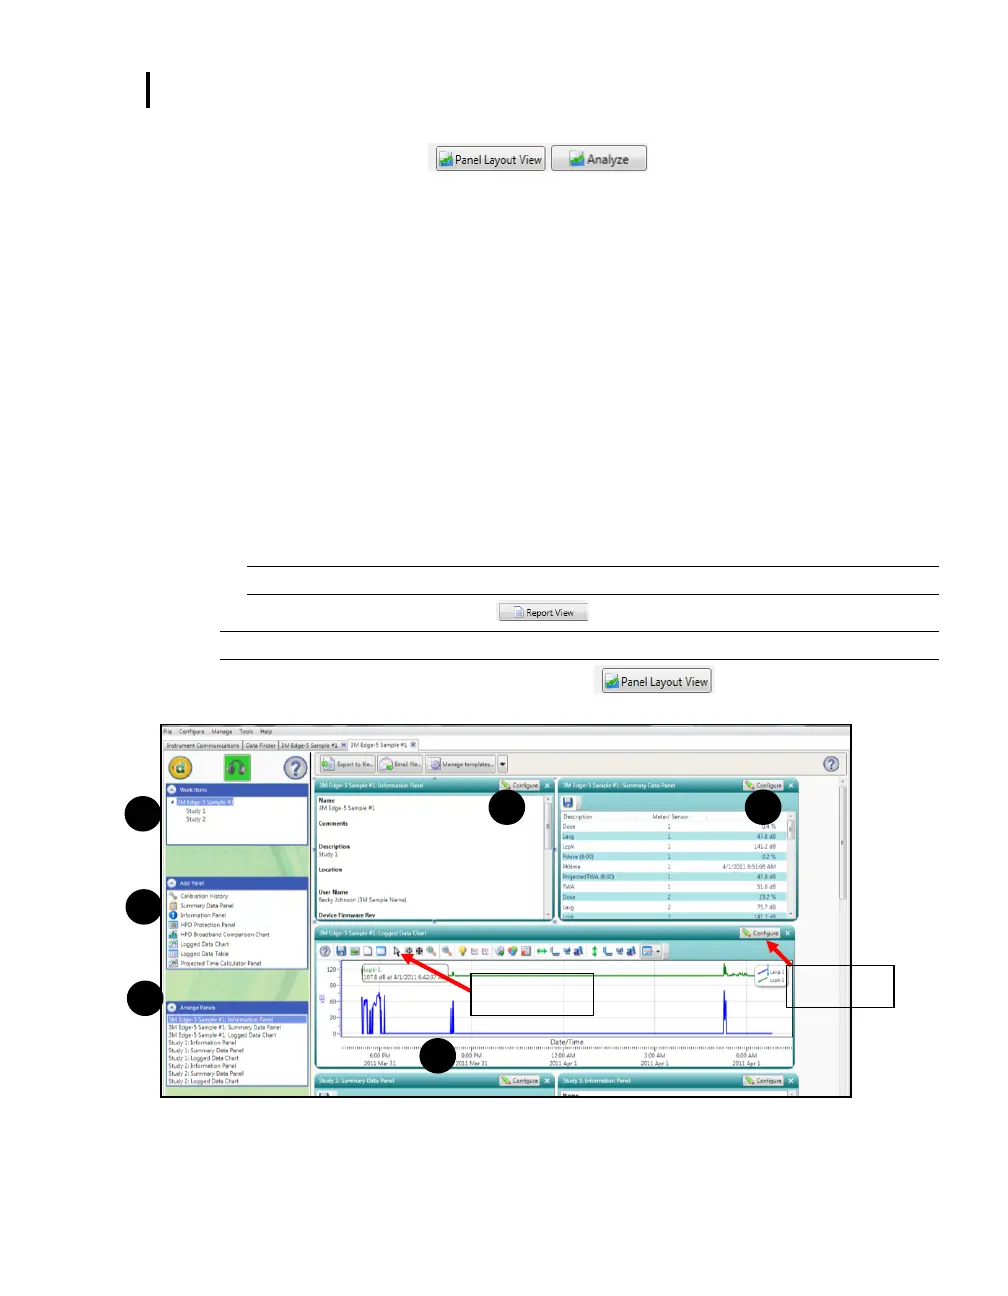
When you are in the data finder page (see above), select either the Analyze button or double-click
on a session/study to view the data in charts and tables as displayed in Figure 5-6. The
measurements and parameters will be displayed in charts and tables which may be customized for
analysis and/or reporting purposes.
1. Panel Layout View is divided into Work Items (see 1), Add Panel (see 2), and Arrange Panels
(see 3) palettes, as well as data panels (see 4).
Work items (1)—select either the session or study (in order to view appropriate
measurement/parameter data).
Add panel (2)—double-click on a chart/table type and it will appear as a panel on your screen.
Arrange panels (3)—displays the order of the charts/tables which appear in the panel layout.
Also, when a chart/table is selected in the arrange panels palette, the associated data panel is
selected. The resize handles are applied and the panel is brought into view. (This is very
useful when several panels are displayed.) To delete a panel, click on a chart/table and press
delete from your keyboard.
Data Panels (4)—used to view your measurement and/or parameters from your study.
NOTE: Use the toolbar bar icons and/or configure button to customize parameters.
2. To view the data as a report, click the button.
NOTE: The panels will print in the order in which they are displayed in the panel layout view.
3. To toggle/switch back to panel layout view, click the button.
Figure 5-6: Panel layout view (viewing the data in charts and tables)
 Loading...