5: Viewing your Studies in DMS
Panel Layout View(charts/tables)
Quick Tips with Panels (charts/tables)
To stretch the panel, click on one of the grips along the panel’s edges and drag the mouse.
The panel will expand or shrink when resizing.
To move the panel, click on the panel’s header and drag and drop to the appropriate panel
position.
NOTE: By default, the panels will snap into place on an invisible grid. Right-click outside
the panel area and click Snap to Grid to clear the checkbox and allow free panel
placement.
To change ranges, when clicking on either the x-axis or y-axis, click and drag the mouse until
the appropriate range is selected.
NOTE: It will span the numbers up or down depending on how you drag the mouse.
To add labels, click on the add labels icon. Right-click and select edit text to add note/label
on the chart. Type in text and press the Enter key (on your keyboard). To move the label, left-
click and hold to drag to appropriate location on chart.
To customize chart colors, click on the icon and using the properties box, select different
colors as needed.
To customize x or y axis font type, click on these or icons.
To export data to .xls file, click on the export icon.
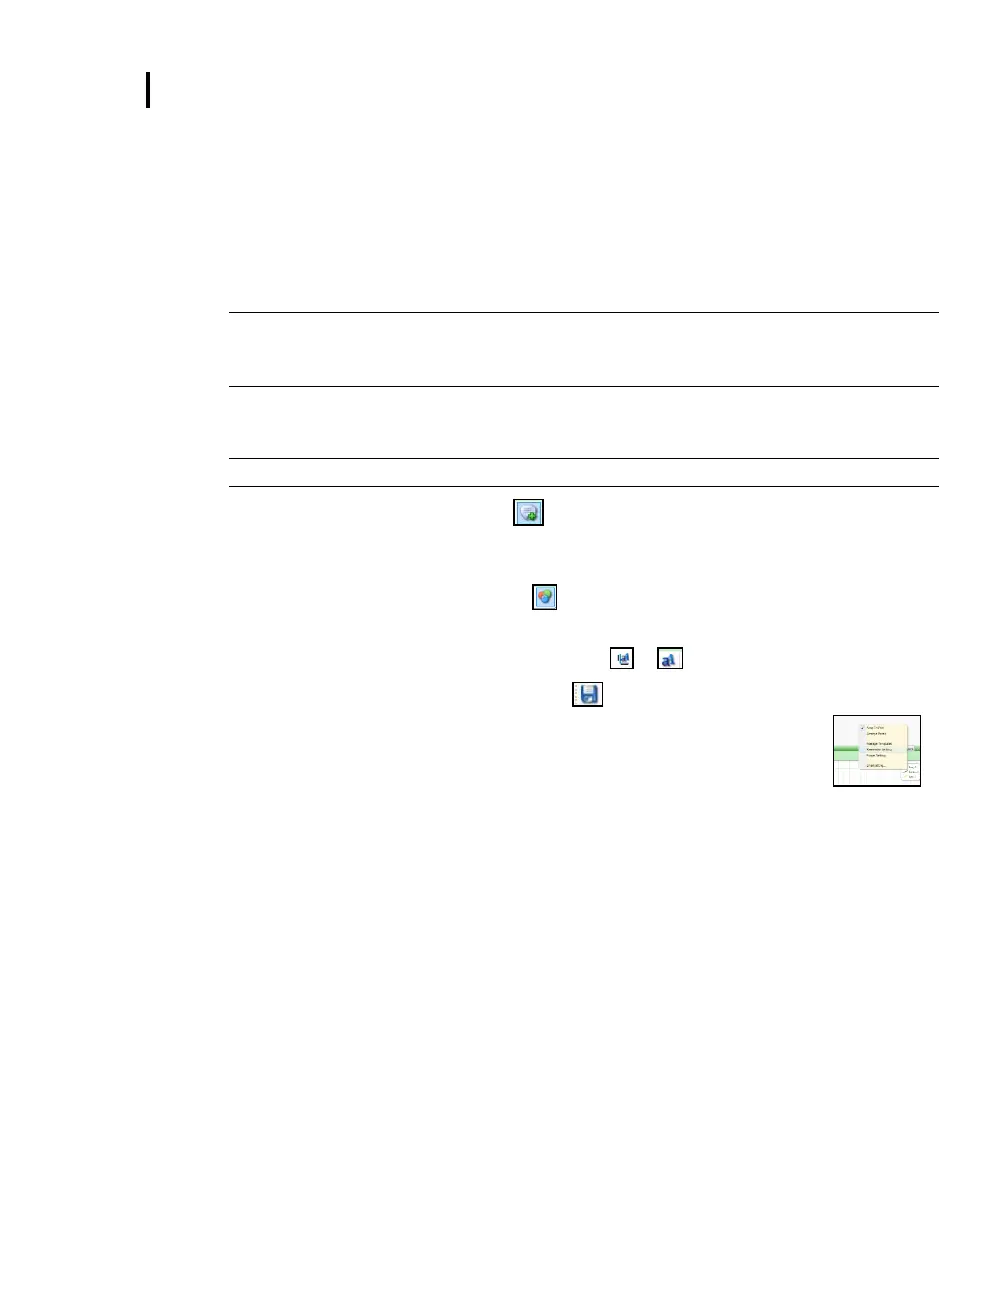
To save a layout, right-click outside the panel area as displayed below.
Click Remember Setting.
 Loading...