4.2.3 Visualize Live Sensor Data with VeloView
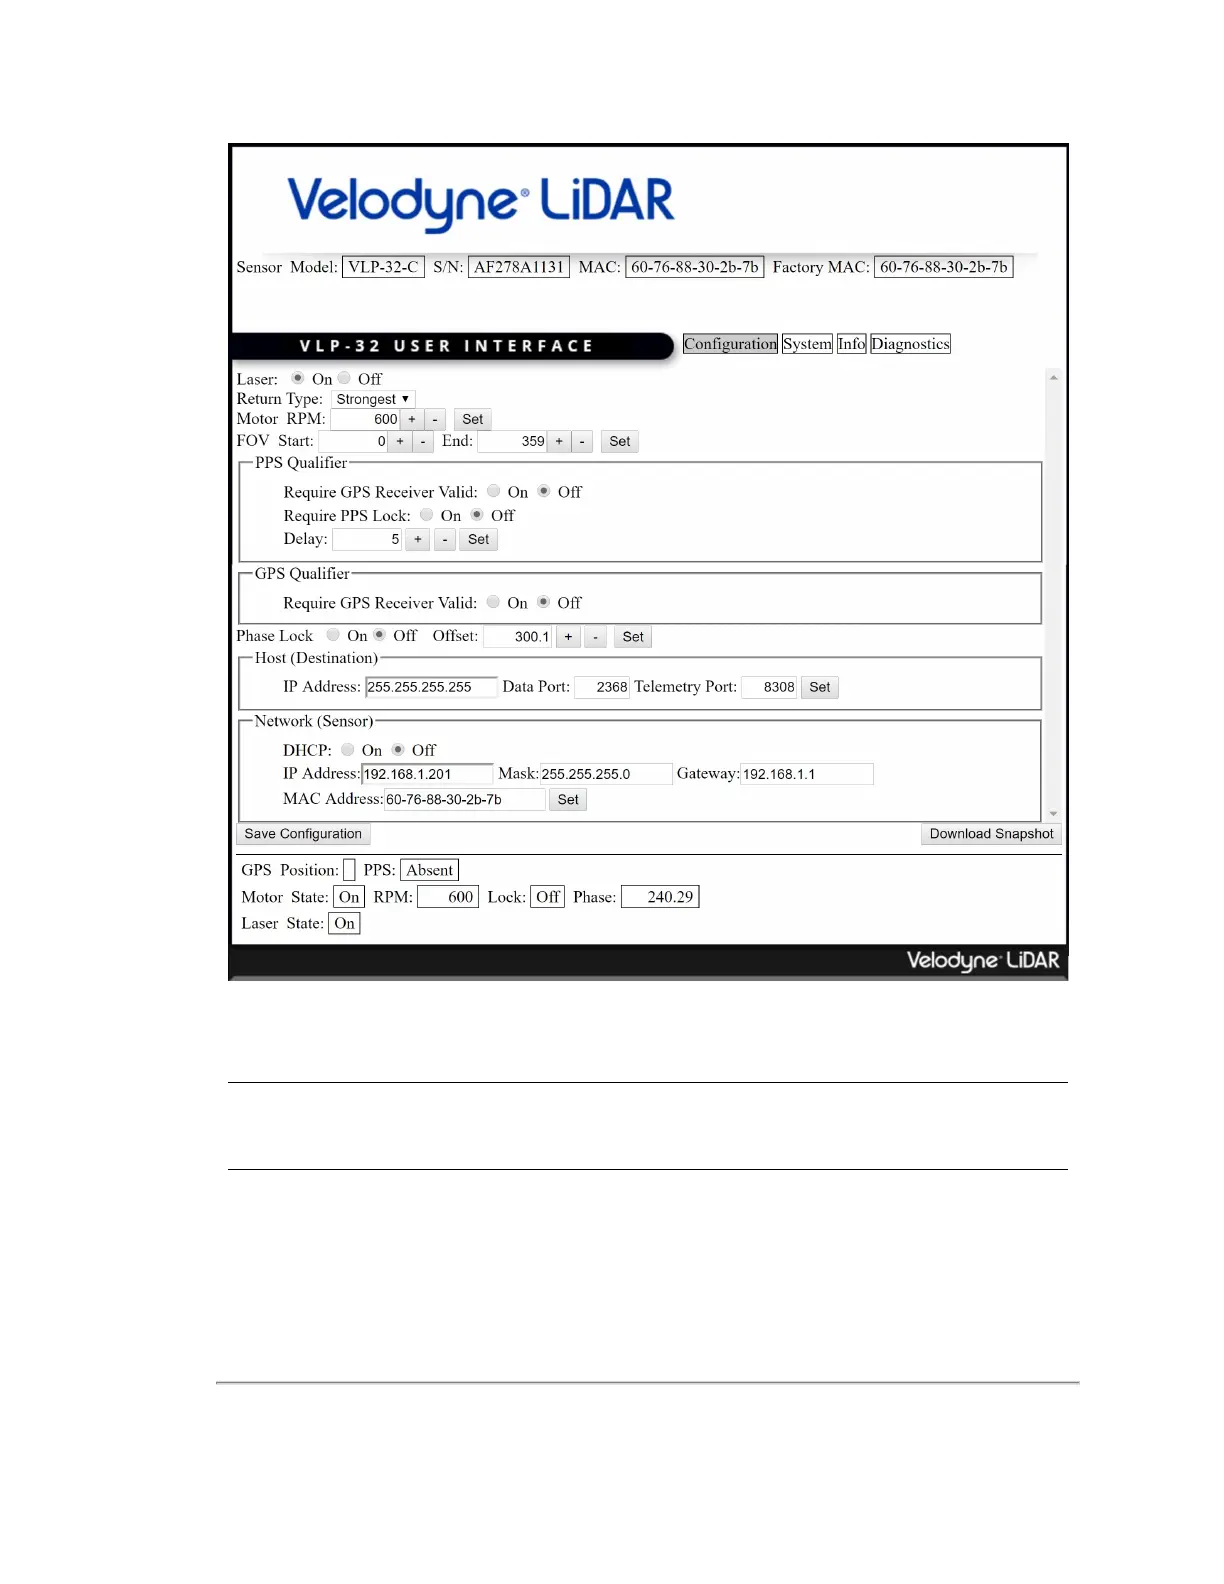
Now that the computer can access the sensor’s Web Interface, it’s time to get a first look at the sensor’s data.
Note: VeloView is an open source visualization and recording application tailored for Velodyne LiDAR sensors. Other
visualization software (e.g. ROS, DSR and PCL) can perform similar functions and may be used instead.
VeloView is documented in more detail in
VeloView on page 108
. If the application isn’t already on the computer, perform
the procedure detailed in
Install VeloView on page 109
. Older versions should be updated to at least the version installed
by following the procedure.
26 VLP-32C User Manual
 Loading...