Spartan-6 FPGA PCB Design and Pin Planning www.xilinx.com 51
UG393 (v1.1) April 29, 2010
SMT Pads
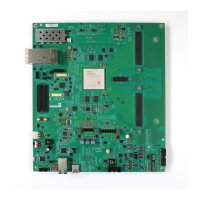
The approximately –40 dB/decade slope in Figure 5-8 shows good fit to the frequency
response of a lumped capacitor.
Next, using simulated measurements on the same transition modeled in HFSS, the time-
domain performance of this transition can be measured by doing a TDR on the
S-parameter results from the earlier frequency domain analysis.
In Figure 5-9 and Figure 5-10, the red curve with the large capacitive dip corresponds to
the SMT pad without the ground plane cleared from underneath. The blue curve shows
that clearing out the ground plane removes much of the excess capacitance. This
improvement can be quantified using Equation 5-1 and Equation 5-2.
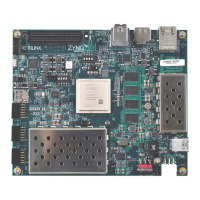
X-Ref Target - Figure 5-7
Figure 5-7: Return Loss Comparison Between 0402 Pad Structures
X-Ref Target - Figure 5-8
Figure 5-8: Return Loss Comparison Between 0402 Pad Structures on Log
(Frequency) Scale
0
-20
-40
-60
024 6
Frequency, GHz
8
Cleared Planes
Uncleared Planes
10
dB(S(3,3))
dB(S(1,1))
UG393_c5_07_091809
0
-20
-40
-60
1E8 1E9
Frequency, Hz
+40dB/Decade RL Slope Shows a
Good Fit to Lumped Capacitance
1E10
dB(S(3,3))
dB(S(1,1))
UG393_c5_08_091809
 Loading...