Math Waveforms 4
Agilent InfiniiVision 3000 X-Series Oscilloscopes User's Guide 87
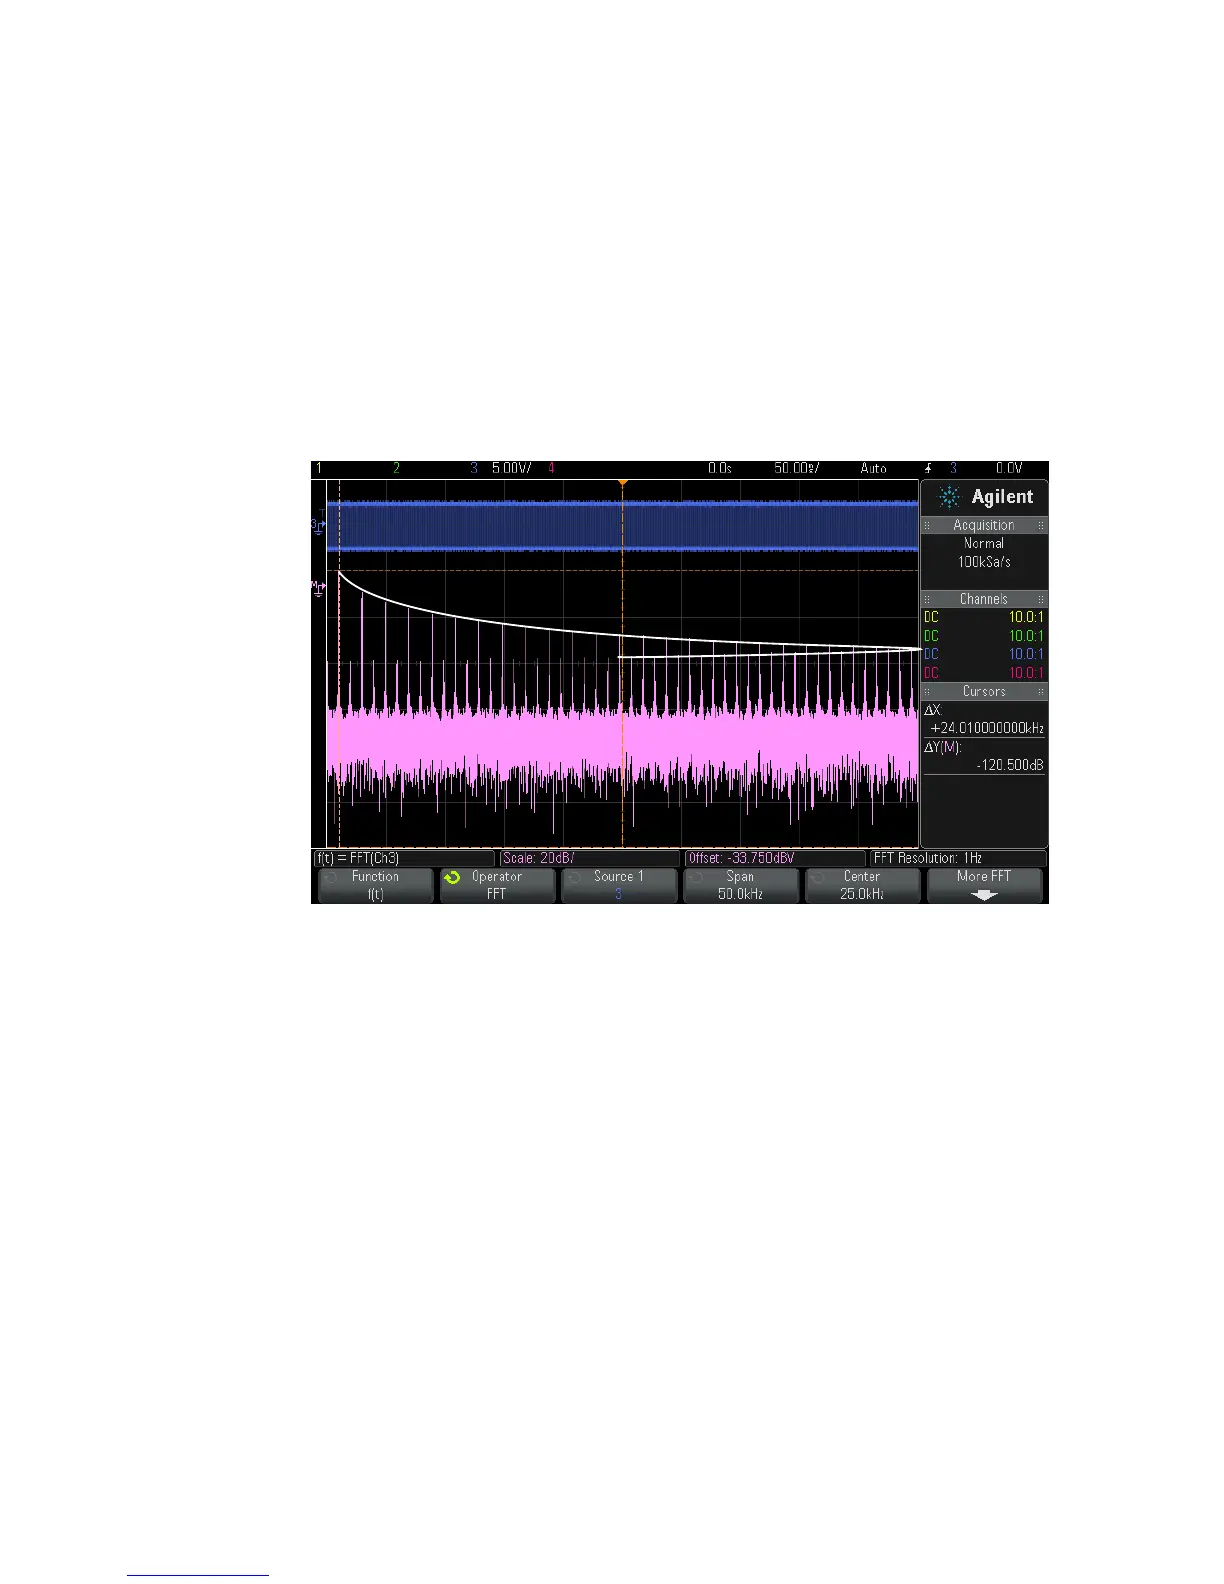
The following figure illustrates aliasing. This is the spectrum of a 990 Hz
square wave, which has many harmonics. The sample rate is set to
100 kSa/s, and the oscilloscope displays the spectrum. The displayed
waveform shows the components of the input signal above the Nyquist
frequency to be mirrored (aliased) on the display and reflected off the
right edge.
Because the frequency span goes from ≈ 0 to the Nyquist frequency, the
best way to prevent aliasing is to make sure that the frequency span is
greater than the frequencies of significant energy present in the input
signal.
FFT Spectral Leakage
The FFT operation assumes that the time record repeats. Unless there is
an integral number of cycles of the sampled waveform in the record, a
discontinuity is created at the end of the record. This is referred to as
leakage. In order to minimize spectral leakage, windows that approach
zero smoothly at the beginning and end of the signal are employed as
filters to the FFT. The FFT Menu provides four windows: Hanning, Flat
Figure 9 Aliasing
 Loading...