Chapter 4 Viewing Images
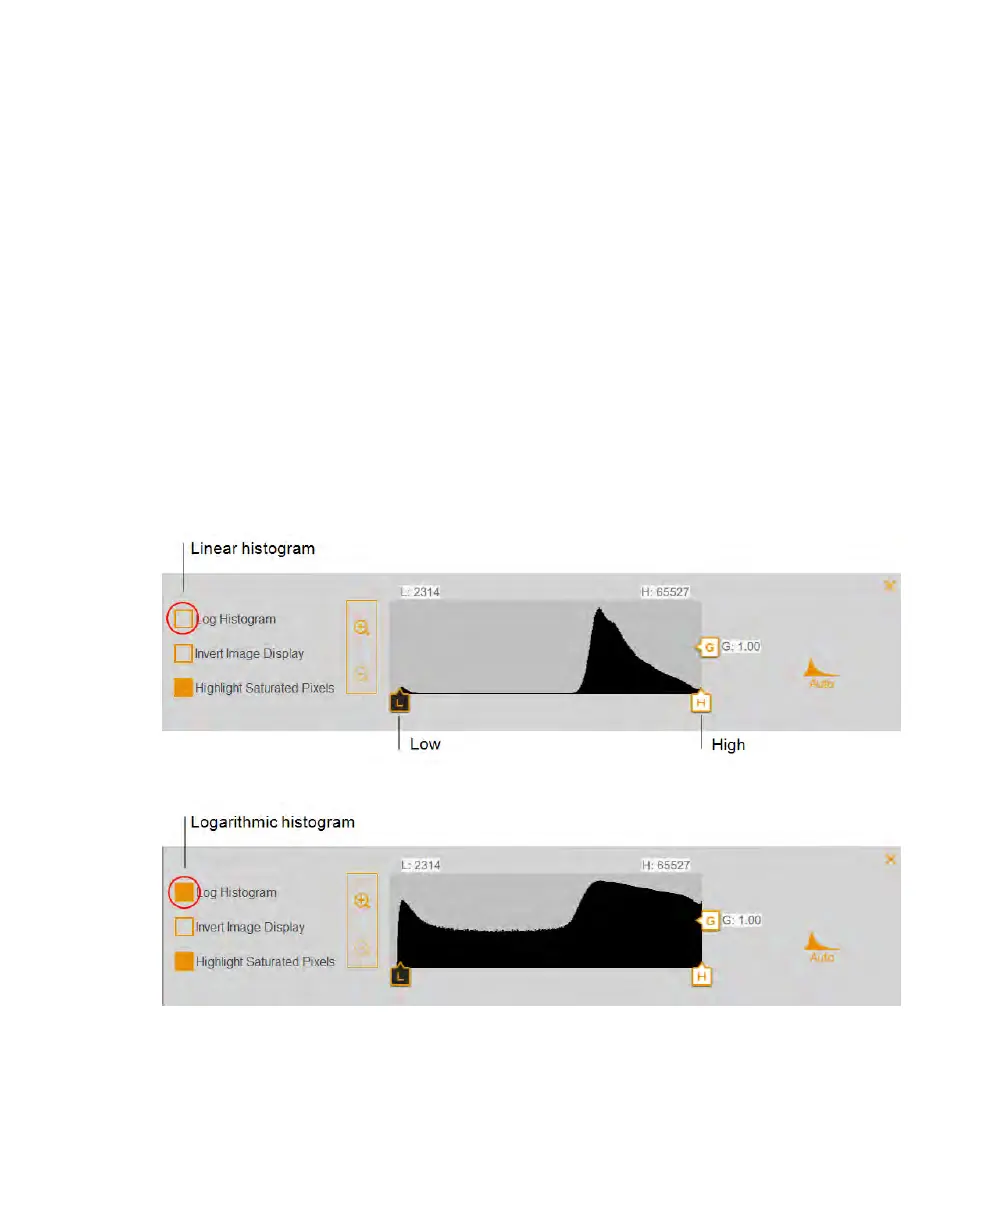
n The High indicator determines which intensity value is shown at the maximum value of
the gray scale in the gel image.
n The Low indicator determines which intensity value is shown at the minimum value of
the gray scale in the gel image.
n The Gamma indicator changes the grayscale curve. A value of 1 is linear. A value <1
redistributes a greater proportion of the gray scale to the first half of the intensity
values. A value >1 redistributes a greater proportion of the gray scale to the second
half of the intensity values.
To change the histogram scale
1. Open an image in Image View and tap Transform.
2. Tap the Log Histogram box to choose the logarithmic scale.
76 | ChemiDoc Touch Imaging System