Adjusting How Images Are Displayed
Tip: The logarithmic histogram can reveal the presence of intensity values that are
otherwise obscured. In images with a large background area, the intensity value
of most of the pixels is that of the background. Often, there are too few pixels at the
intensity values of the data peaks of interest to make these peaks readily visible in
a linear histogram.
The linear histogram can be useful when the intensity values are more evenly
distributed. Used in combination with the logarithmic histogram, the linear histogram
shows more clearly the relative quantity of pixels at each intensity value.
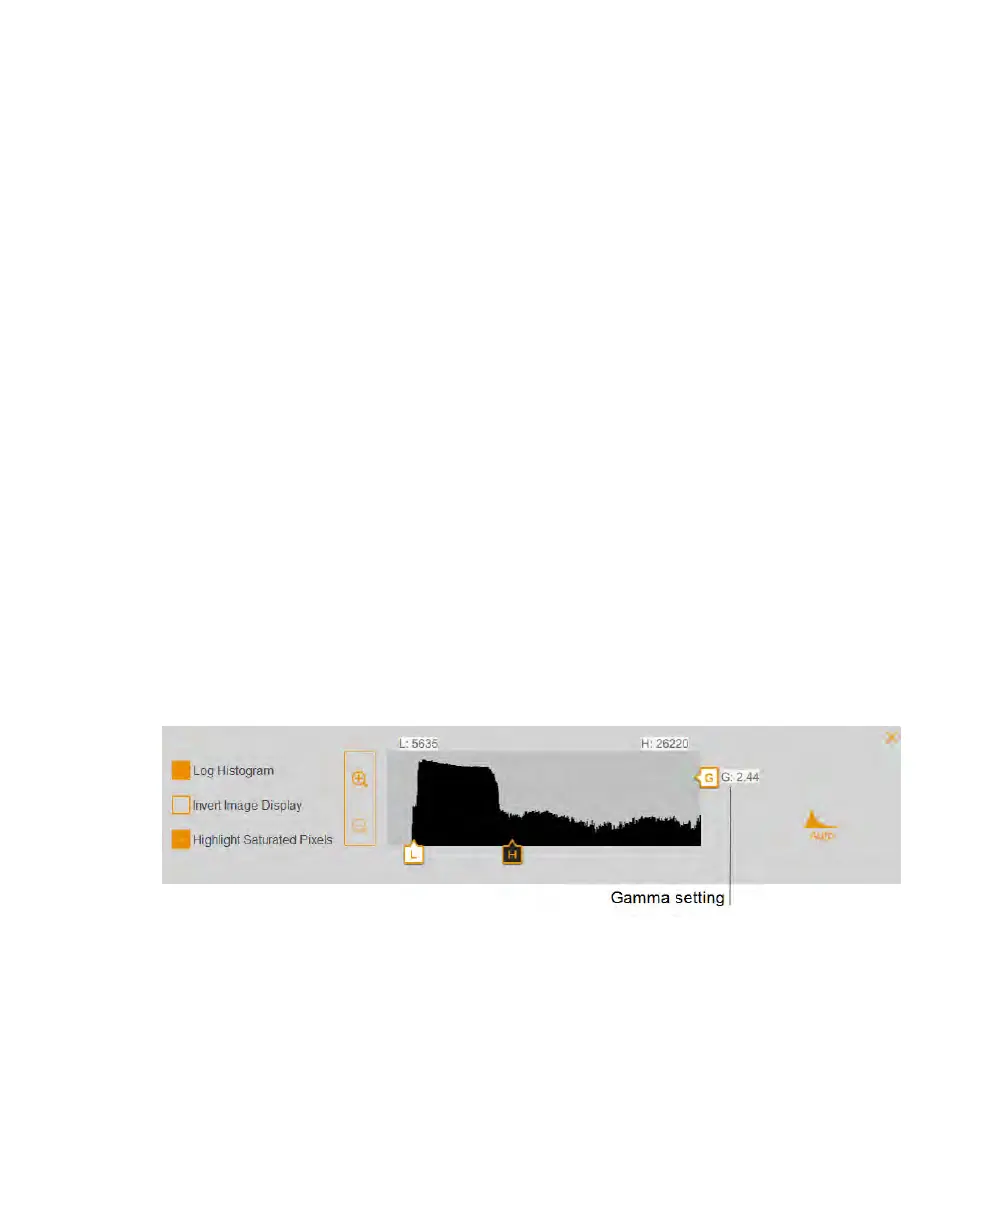
To change the light intensity range displayed in the image
u Tap and drag the Low or the High slider.
n Dragging the Low slider to the right reduces the background and low-intensity
bands and makes it easier to visualize high-intensity bands.
n Dragging the High slider to the left makes it easier to visualize the background,
nonspecific binding, and low-intensity bands. However, dragging the High slider
to the left will further darken intense bands so they appear overexposed.
To adjust the grayscale curve
u Tap and drag the gamma slider control or touch anywhere in the slider bar.
User Guide | 77