833-3577 CB-FALCON SYSTEM OPERATOR INTERFACE
65-0296—01 38 750-241
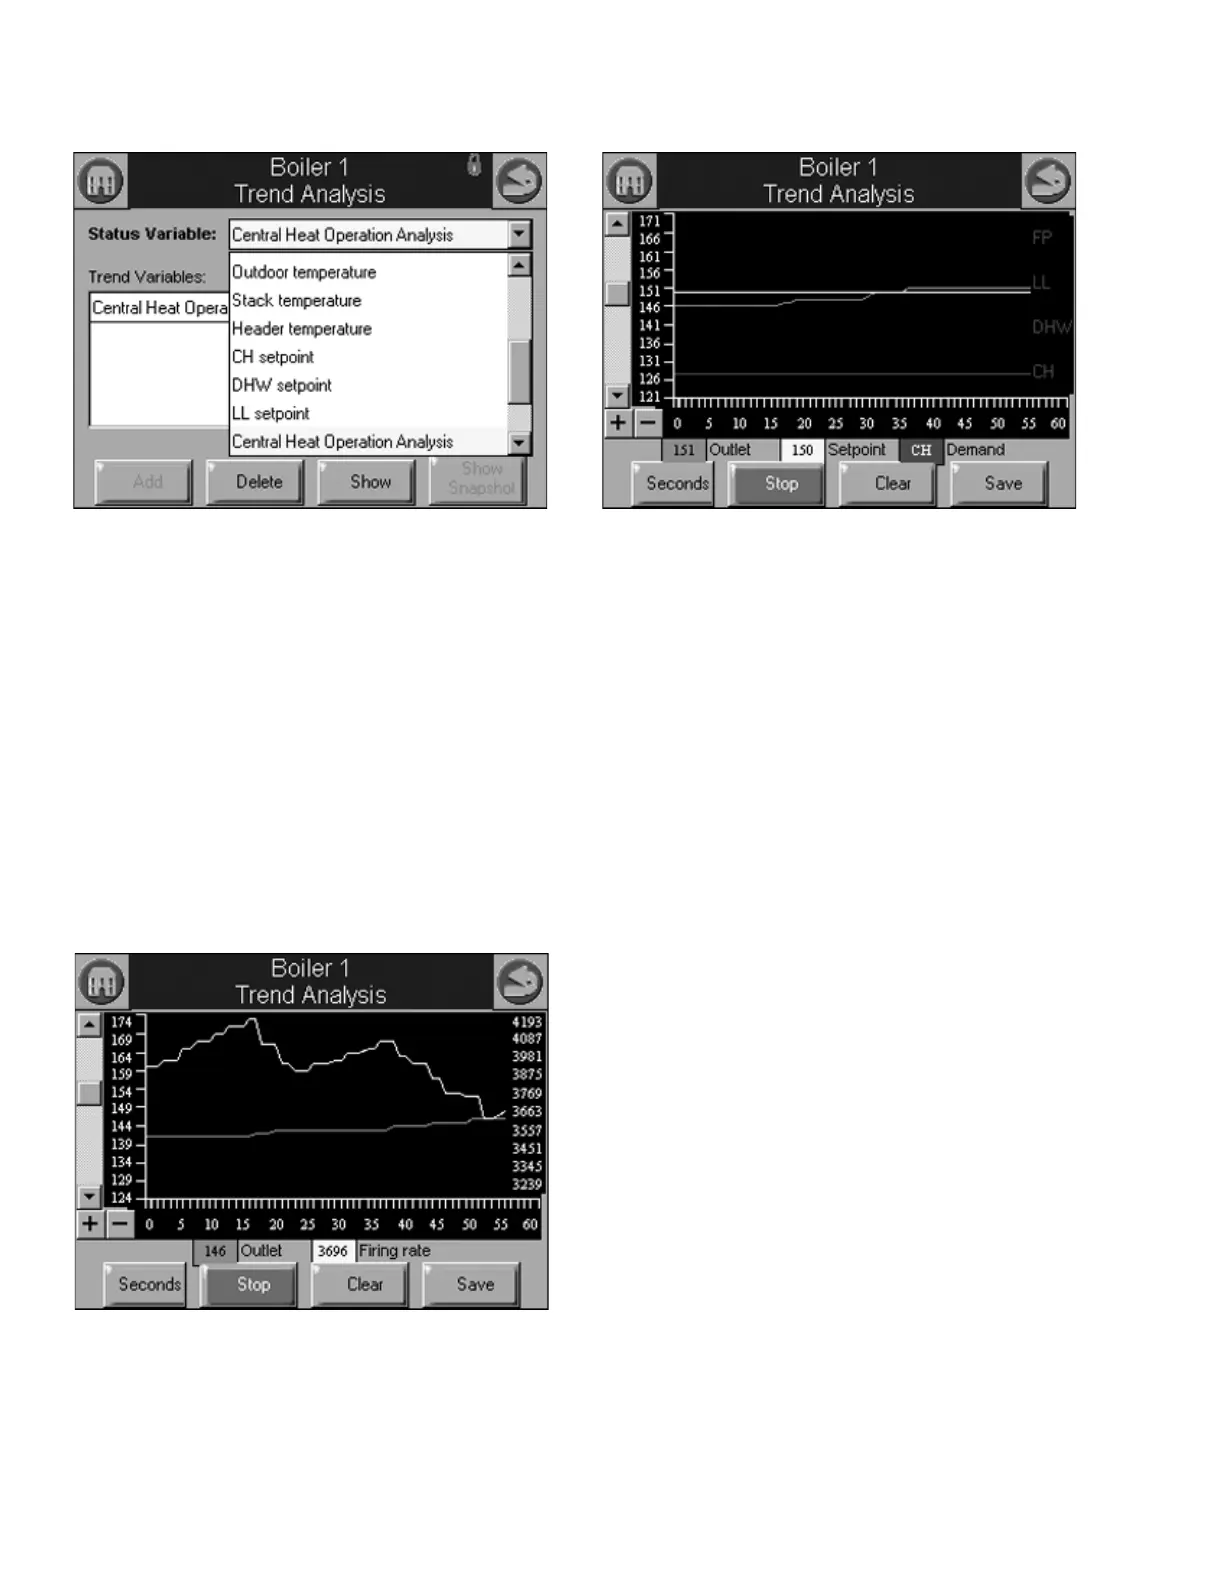
Fig. 93. Trend analysis menu page.
Each status variable displayed in the trend analysis is
represented by a different colored line, as follows:
1. First status variable = green
2. Second status variable = yellow
3. Third status variable = red
4. Fourth status variable = blue
No more than two different measurement units (such as
degrees), are allowed for the status variables selected in the
trend analysis graph. Attempts to add a status variable with a
third measurement unit are rejected.
A second Y axis is displayed on the right side of the graph to
represent the scale for the second measurement unit. This
can result in minor clipping of the curves on the right side, as
shown in Fig. 94 and 95.
Fig. 94. Trend analysis page with firing rate.
Fig. 95. Trend analysis page with demand source.
If any of the status variables has degrees as a unit of
measurement, degrees is used for the main Y axis (on the left
of the graph). The status variables selected are saved and are
displayed by default when the trend analysis menu page is
first displayed. Status data is updated on the graph with new
status at the same rate as the sample time period selected.
The current sample time period is displayed in a button on the
page (in Fig. 94 and 95, the button is “Seconds”).
Status older than the sample time period is dropped from the
right end of the curve as newer status appears on the left end
of the curve.
Trend data can be viewed in one-second (most recent 60
second time period), 15-second (most recent 15-minute time
period), and hour (most recent 24 hour time period) intervals.
NOTE: Full graphs require that the 833-3577 has been mon-
itoring the 833-3639 for the complete time period.
Partial graphs display if this is not the case.
The buttons at the bottom can be used to change the view of
the graph. The user can change the sample rates of the
display by pressing the Seconds, Minutes, Hours, or Days
button (the button changes depending on what sample rate is
currently displayed). The + and - buttons zoom in and out of
the graph so the Y axis depicts different degrees of detail for
the data range. The viewing window can be moved up and
down the graph to see the complete range when zoomed in.
The smallest measurement interval is a single whole digit (no
fractional precision) when the entire range exceeds 10 units,
e.g., 20–30 degrees.
Pressing the Stop button will pause trend data updates of the
graph. The graph “freezes” the view when stopped. However,
trend data sampling from the 833-3639 continues regardless
whether the graph update is stopped or not. Restarting the
updates causes the graph to be refreshed with the latest data
samples.
Pressing the Clear button will clear the trend sample data for
an 833-3639. All trend data for the 833-3639 is cleared
including status variables that are not included in the graph.
The user is asked to confirm this action before proceeding.