833-3577 CB-FALCON SYSTEM OPERATOR INTERFACE
750-241 37 65-0296—01
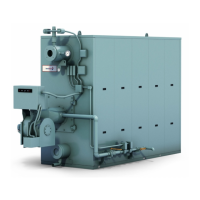
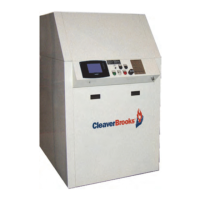
Fig. 89. Lead Lag Status menu (middle).
Fig. 90. Lead Lag Status menu (bottom).
Trend Analysis Page
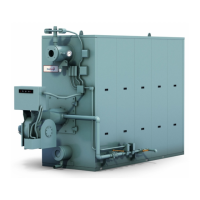
Trend analysis of 833-3639 status data can be viewed on the
833-3577. A graph displays a historical view of 833-3639
status data over varying time periods.
A 2-dimensional graph with status data values shown on the Y
axis over time specified on the X axis is displayed. Status for
the most recent time is represented on the left side of the
graph with older status running towards the right side of the
graph.
Fig. 91. Trend analysis page.
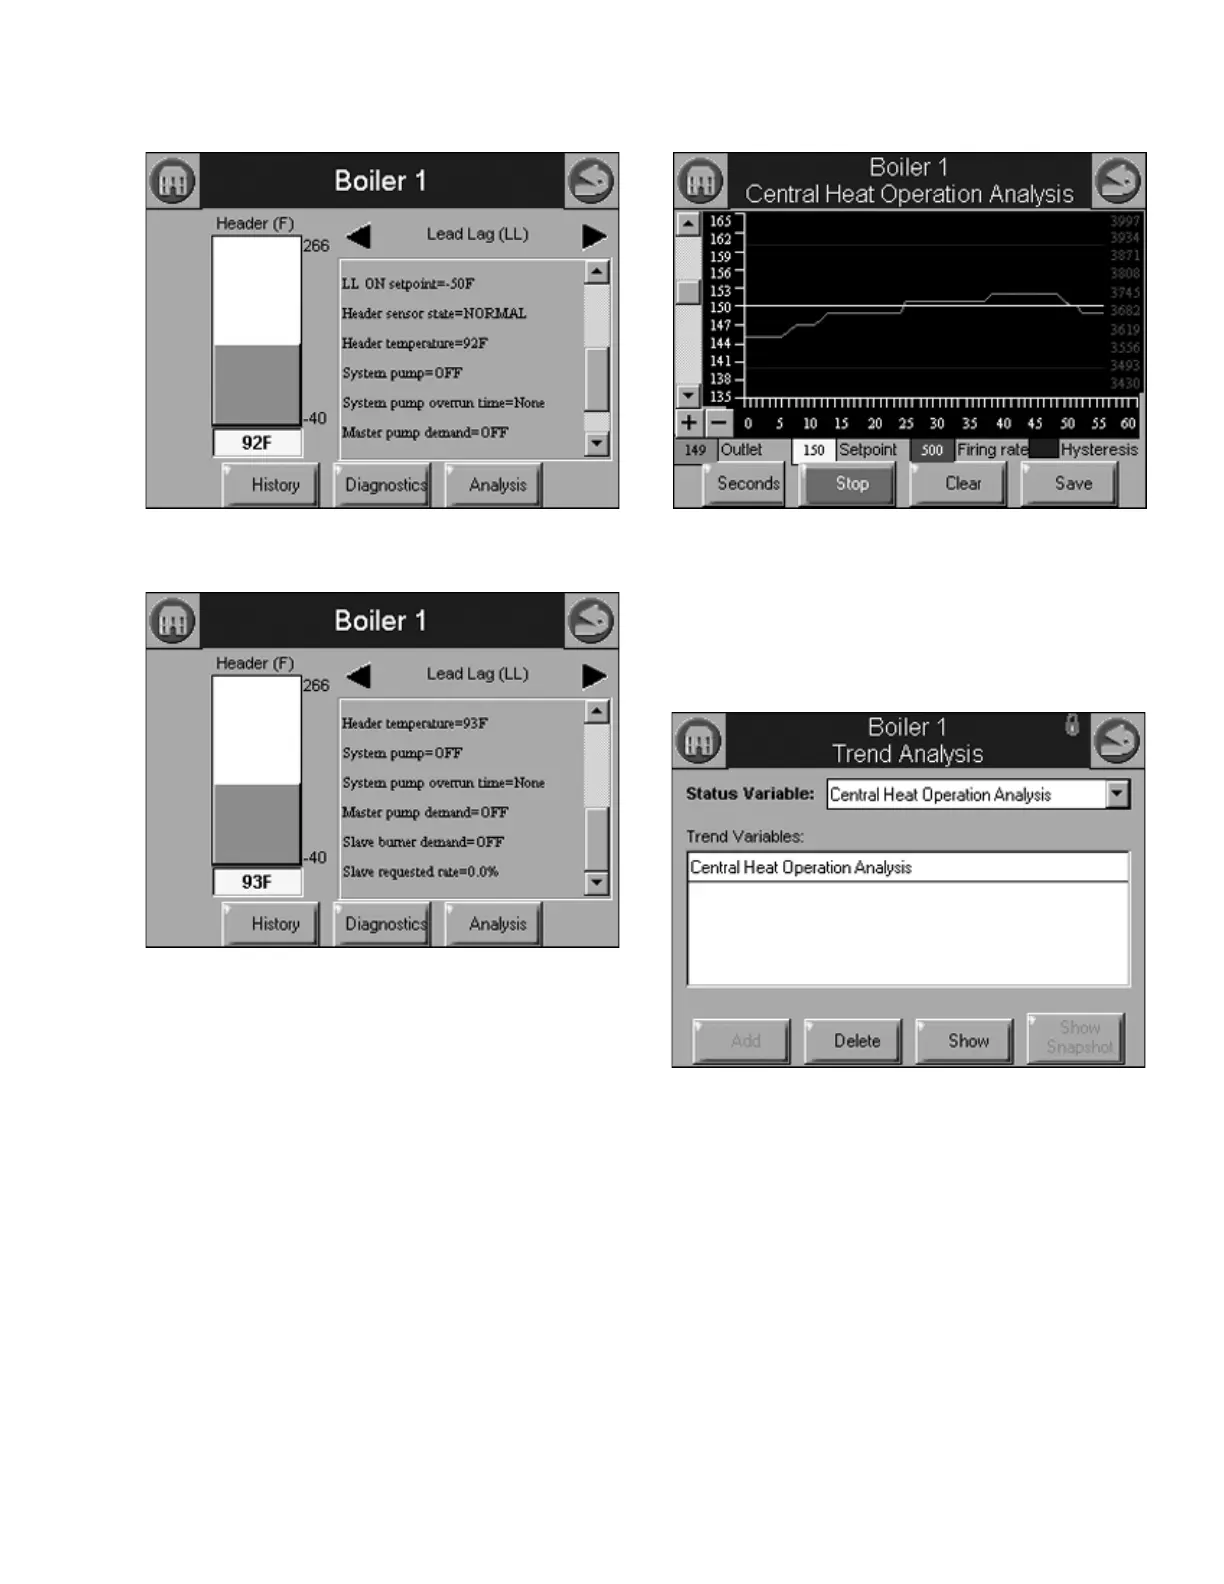
Up to 4 833-3639 status variables can be viewed at the same
time on one trend analysis graph. Select the status variables
for the graph on the menu page (see Fig. 92). This menu
displays when the Trend Analysis button is selected on the
833-3639 status page.
Fig. 92. Trend analysis menu page.
The status variable with the largest range (minimum to
maximum) is used as the Y-axis range in the graph.
As the status variables are selected they are listed in a trend
variables list box. The user chooses the status variables from
a drop down menu and then presses the Add button to add
each status variable to the trend variable list. See Fig. 93.
After all status variables have been selected press the Show
button to view the trend analysis graph.