ProtoNode Gateway
750-426 39
A.2. Viewing Diagnostic information
Type the IP address of the ProtoNode into your web browser or use the FieldServer Toolbox to con-
nect to the ProtoNode.
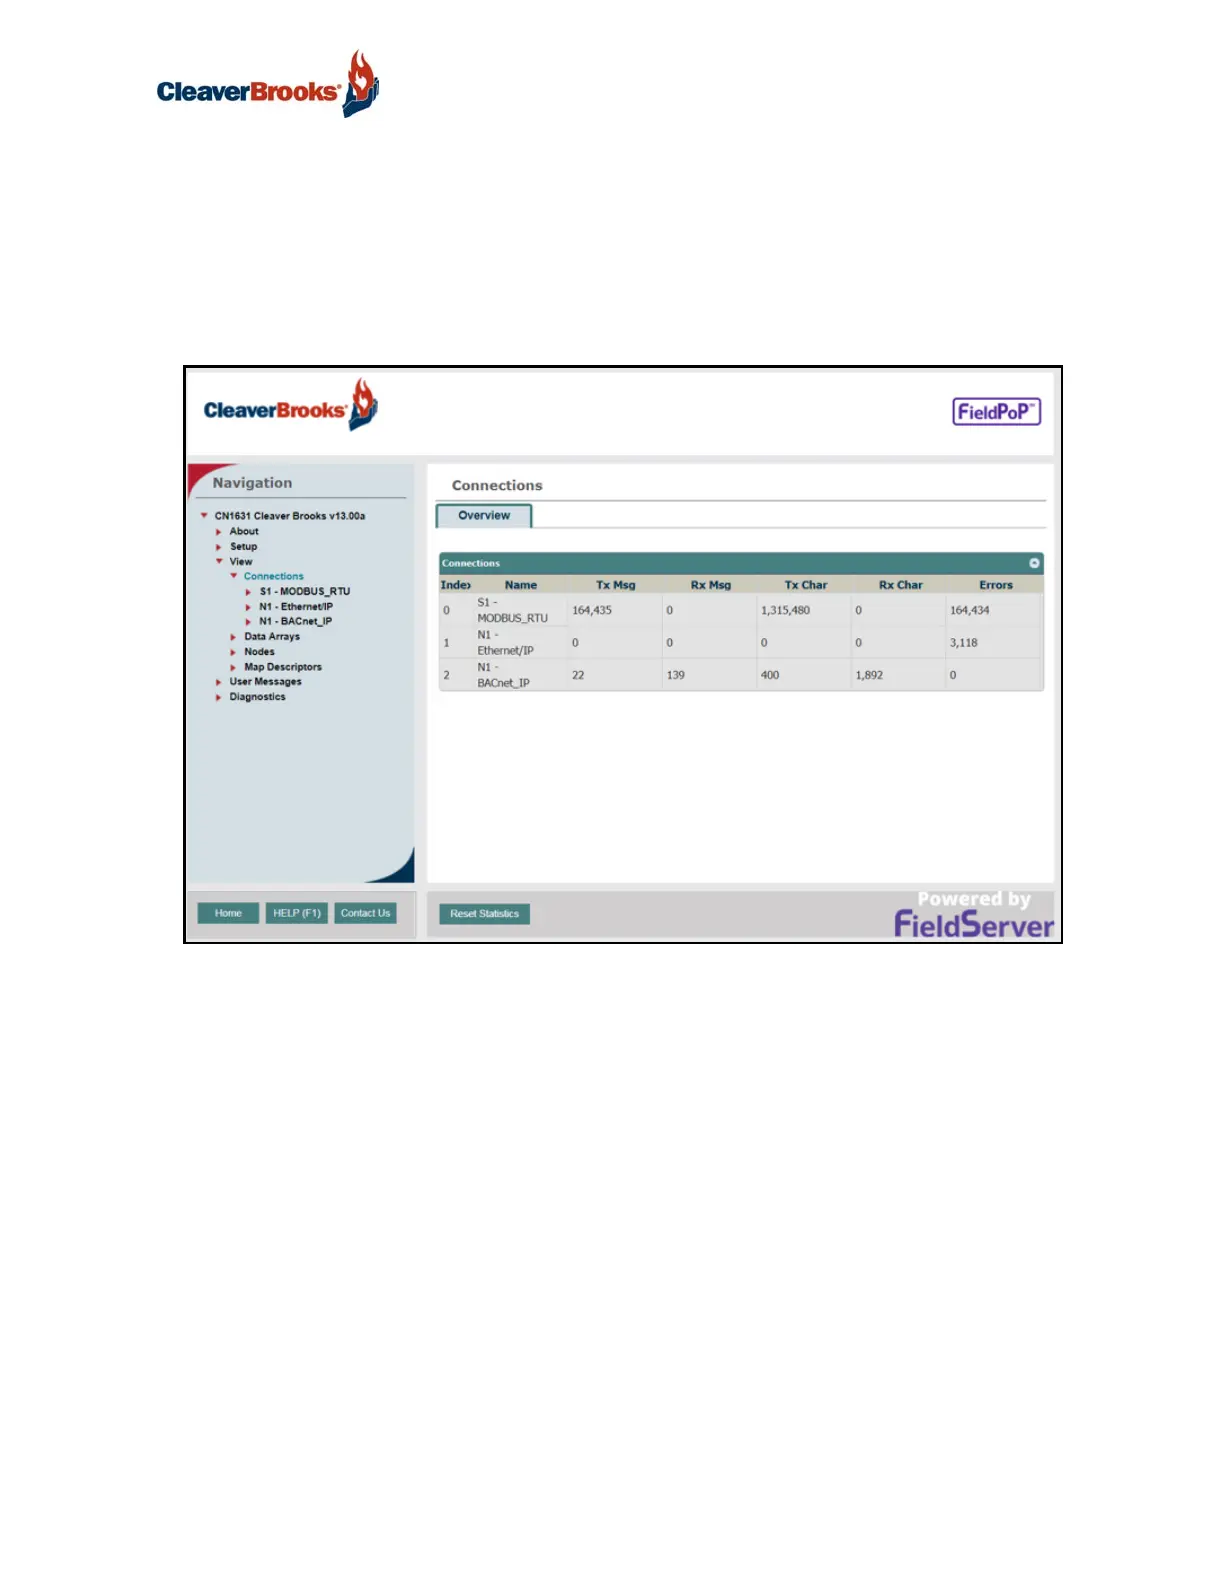
Click on Diagnostics and Debugging button, then click on view, and then on connections.
If there are any errors showing on the Connection page, please refer to Appendix A.3 for the relevant
wiring and settings.
FIGURE 43 - Error messages screen