29
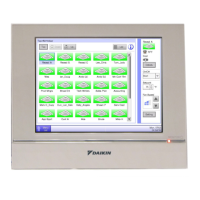
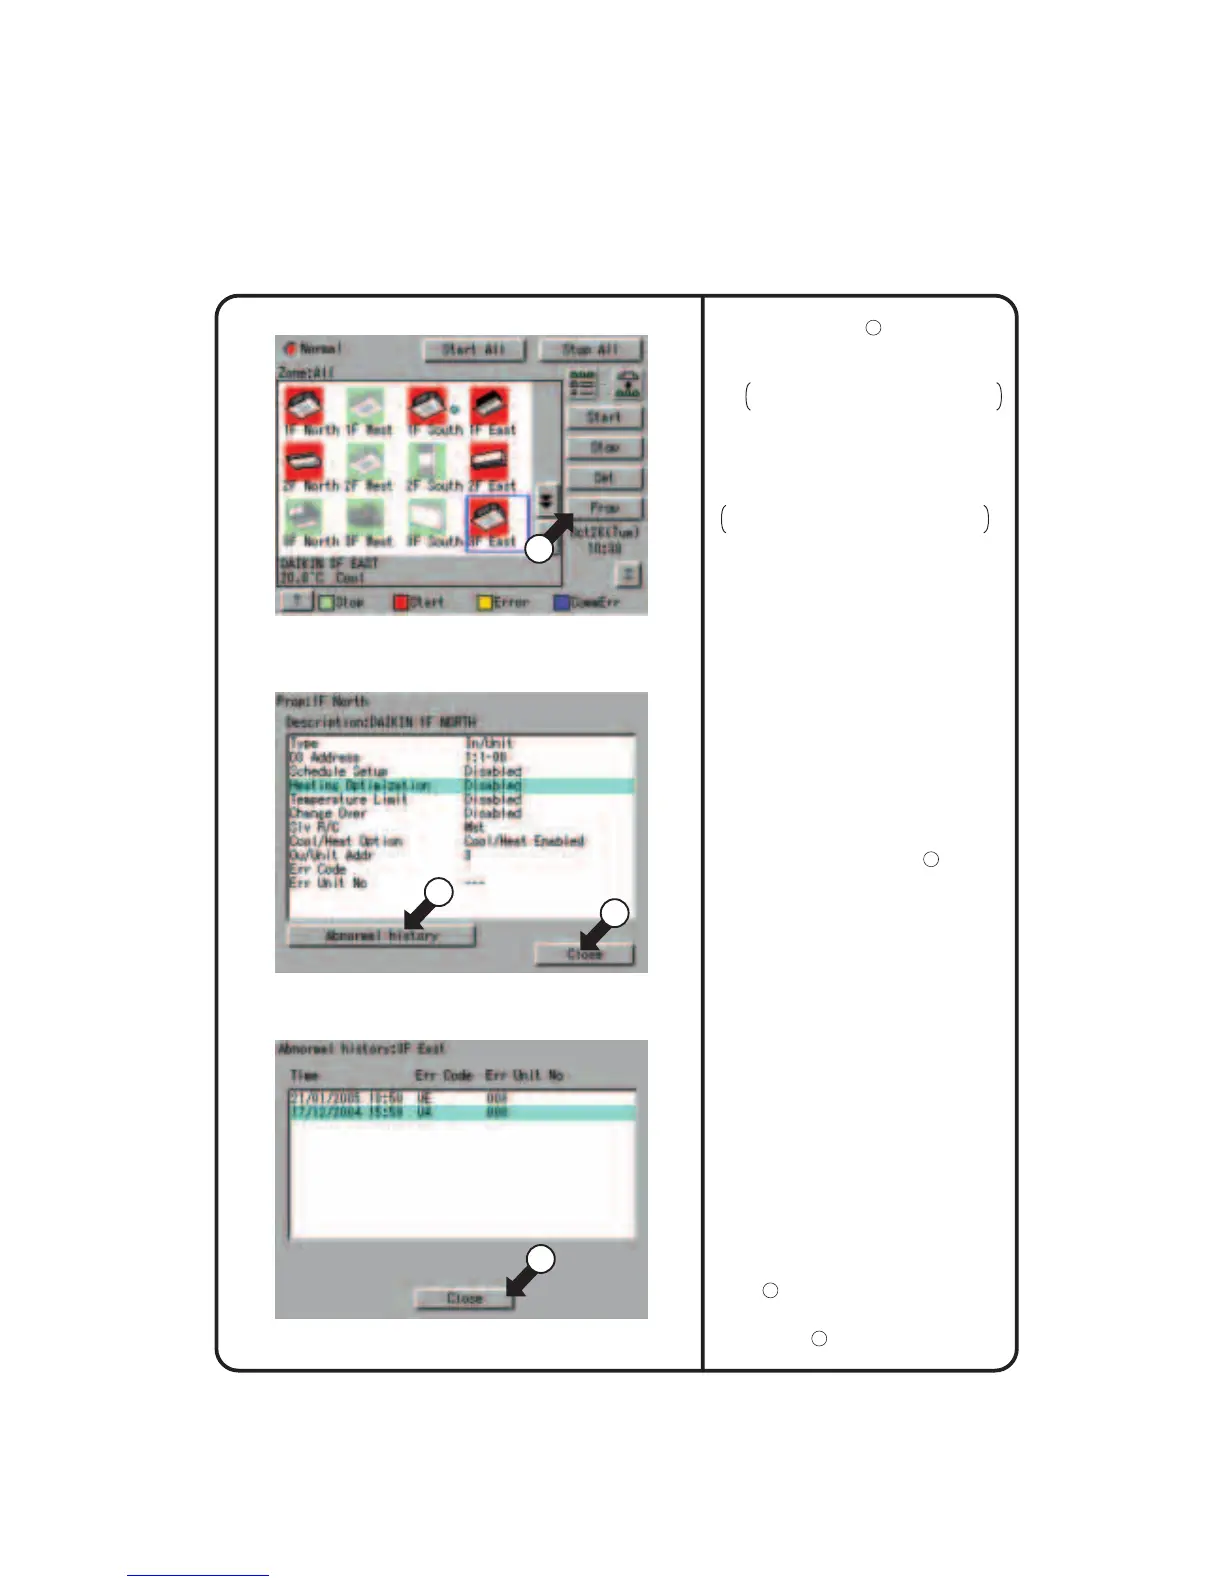
Screen 4 Monitoring Screen (Icon Display)
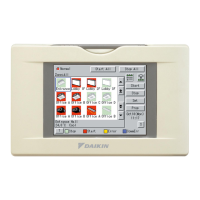
Screen 5 Detailed Information Screen
Screen 6 Fault History
17
Monitoring Detailed Information
18
19
20
Name : Group name
Detailed name : Detailed group name
Ty p e :
Air-conditioner / ventilation / D3Dio / D3Di
D3 Address : 1:1-00 to 1:4-15
When DIII-NET Plus adapter is enabled:
1:1-00 to 2:4-15
Schedule Setup : Enabled or disabled
Heating Optimization : Enabled or disabled
Temperature Limit : Enabled or disabled
Change Over Settings
: Enabled or disabled
SIv R / C : Parent or child
Cool / Heat Option
: Presence / Absence / Under Selection
Ou / Unit Addr : Outside unit address
Err Code : 2-digit error code in
case of error occurence
Err Unit No
: [–]
for no error or unit number for error
5.
Push [Prop] button
17
.
The following maintenance data is
displayed on the Detailed Information
Screen Screen 5.
Note that screens in the left-hand
column are examples for group selection.
6.
Push [Abnormal history] button
18
to display
the
Abnormal
History Screen (Screen
6).
[For group selection]
Name : Zone name
Detailed name : Detailed zone name
Start1By1 : Enabled or disabled
Nb of Regist Grp : Number of groups registered in a zone
Schedule Setup : Enabled or disabled
Name : group name
Detailed name : Detailed group name
Error log :
• Time : Error occurrence time
• Err Code : 2-digit error code
• Err Code No : Unit number
The following data is displayed on the
Abnormal History.
[For zone selection]
[For group selection]
Name : group name
Error log :
• Time : Error occurrence time
• Name : Error occurrence group name
• Err Code : 2-digit error code
• Err Code No : Unit number
Top 10 error logs are displayed, assigning
the highest priority to the time of the latest
error.
∗ When the same error recurs, the error time
is renewed.
Check for display data and push [Close]
button
20
to return to the detailed
information screen Screen 5. To return to
the Monitoring Screen Screen 4, push
[Close] button
19
on that screen.
[For zone selection]