G6 Pro User Guide
127Appendix G: Technical Information
Trend Accuracy
Trend accuracy explains how well the G6 captures the time-
dependent characteristics of glucose fluctuation.
The following examples quantify G6’s Trend Accuracy:
1. When the G6 CGM rate of change is rapidly rising (≥ 2 mg/dL/min),
how often is reference glucose also rising? The answer is 71.3% of
the time for adults and 67.1% for pediatrics.
2. When the G6 CGM rate of change is rapidly falling (≤ 2 mg/dL/ min),
how often is reference glucose also falling? The answer is 98.0% of
the time.
3. When the G6 CGM rate of change is stable (≥ -1 mg/dL/min and ≤ 1
mg/dl/ min), how often is glucose changing rapidly (≥ 2 mg/dL/min
or ≤ 2 mg/dL/ min)? The answer is only 1.9% of the time.
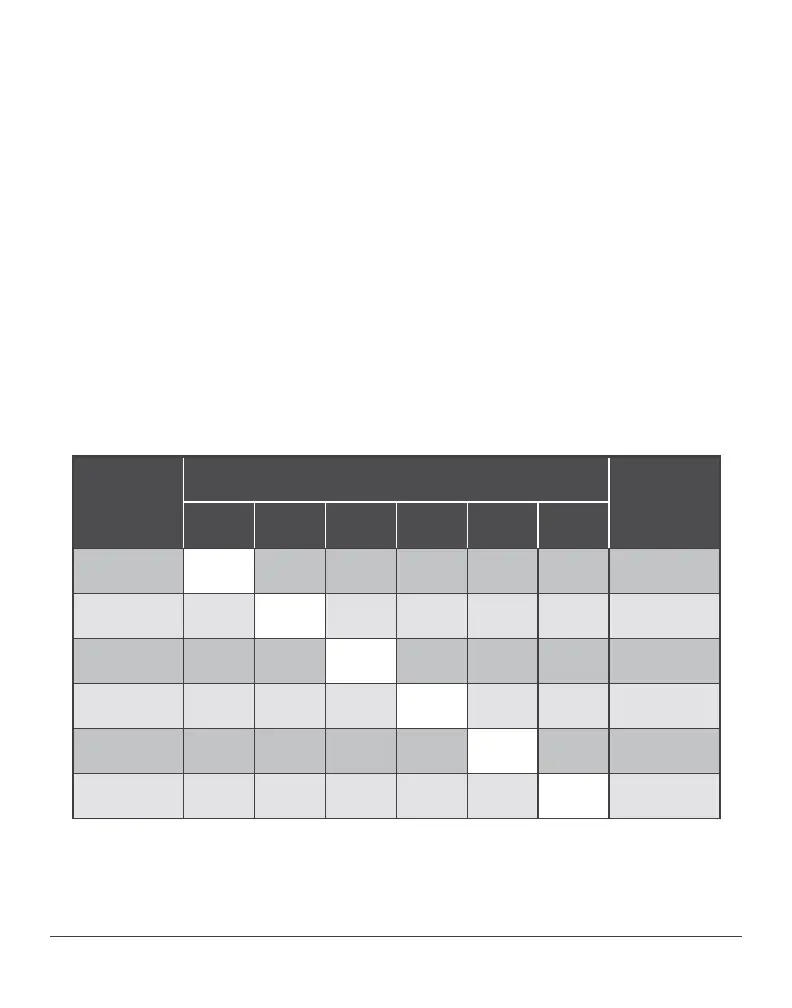
Table 4-A� Trend Accuracy Rate of Change (Adults; n=159)
CGM Rate
Range
(mg/dL/
min)
YSI glucose range (mg/dL)
CGM-YSI
Pairs
(n)
<-2 [-2,-1) [-1,-0) [0,1] (1,2] >2
<-2 53.3% 35.0% 9.9% 1.5% 0.0% 0.2% 463
[-2,-1) 7.4% 56.9% 32.5% 2.9% 0.3% 0.0% 2,077
[-1,0) 0.4% 9.5% 76.9% 12.5% 0.6% 0.1% 7,986
[0,1] 0.1% 1.0% 26.2% 60.6% 10.6% 1.6% 5,199
(1,2] 0.0% 0.4% 3.1% 26.8% 52.9% 16.8% 1,734
>2 0.1% 0.1% 0.8% 5.6% 22.1% 71.3% 1,367