User Mode
83
6
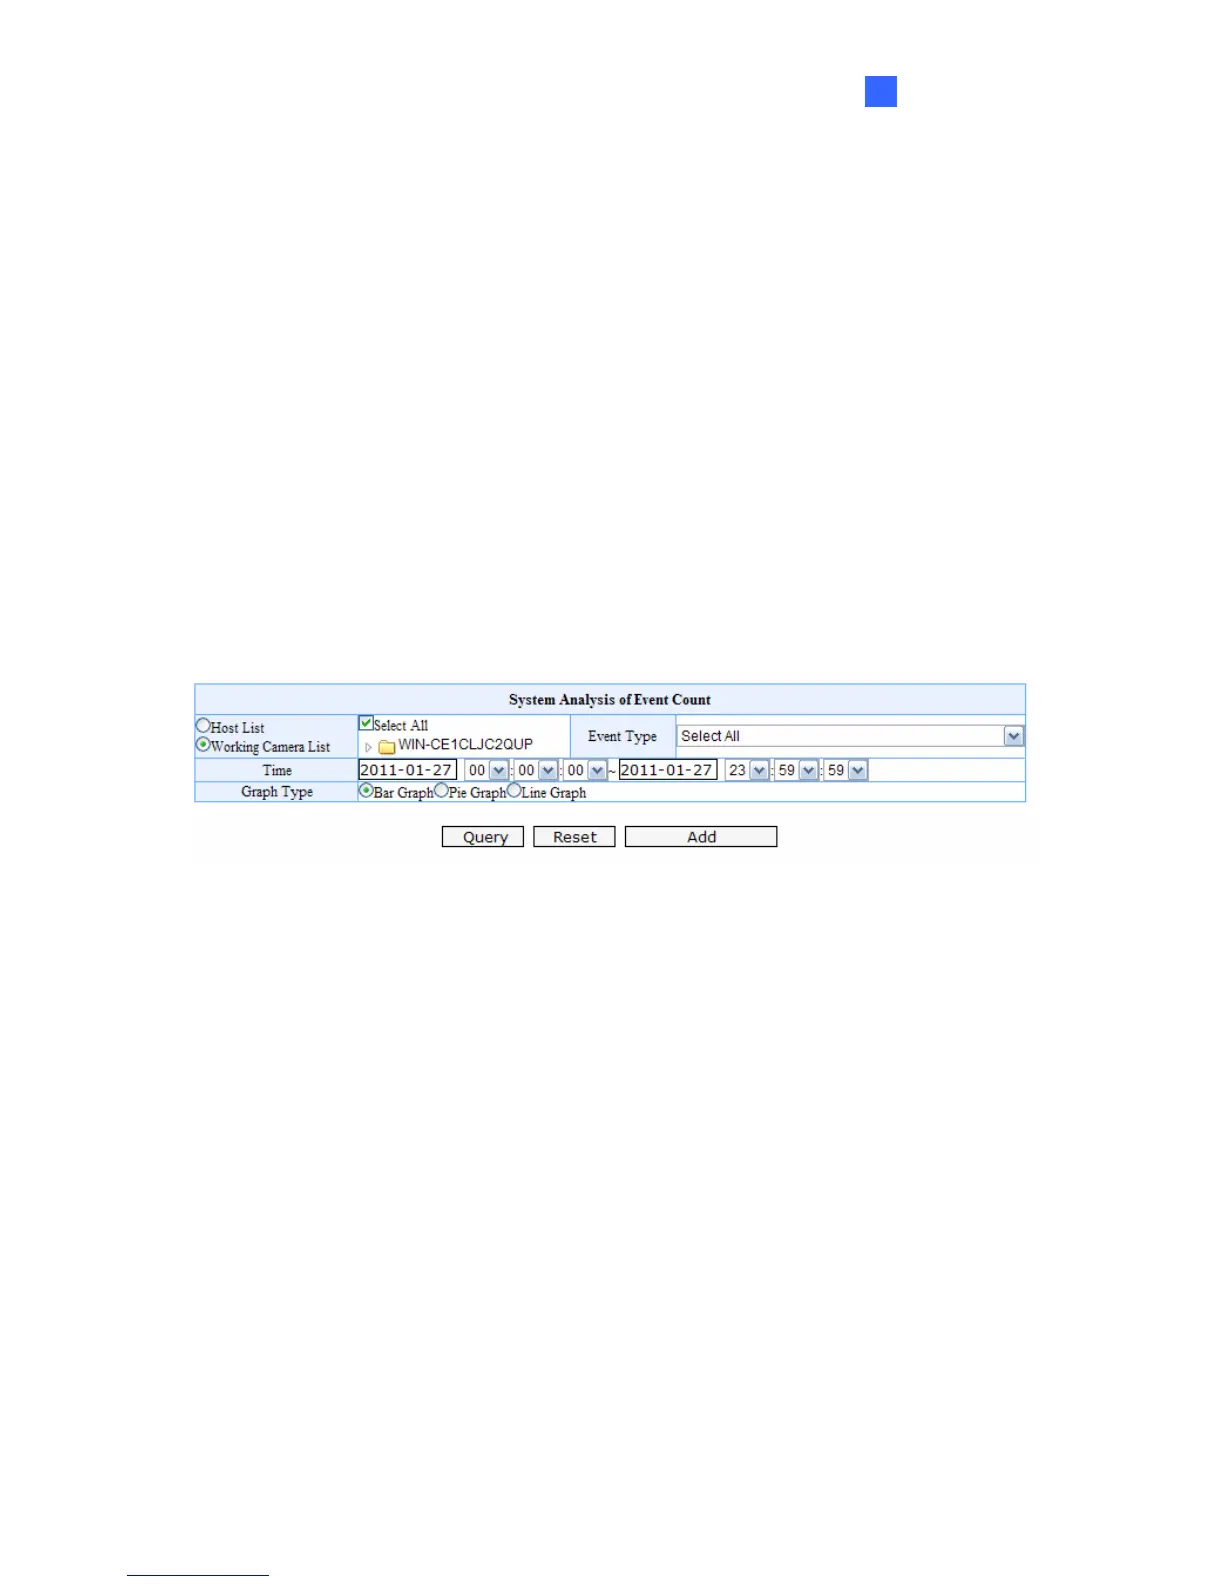
6.9 Chart Analysis
Using the Chart Analysis, you can see the following types of data analysis presented in three
types of graph: bar, pie and line graph.
• System Analysis of Event Count: Shows event counts of each type of system event.
• Monitor Analysis of Event File Size: Shows the total file size of events recorded under
each recording policy.
• Monitor Analysis of Event Count: Shows event counts of events recorded under each
recording policy.
• Monitor Analysis of Time File Size: Shows total file size of all videos recorded in a
month, a day and an hour.
To search for System Analysis of Event Count, Monitor Analysis of Event File Size, or
Monitor Analysis of Event Count, follow the steps below:
Figure 6-19
1. Select Working Camera List or Host List to list all connecting cameras or list cameras
by IP video devices.
2. Click the server name and select the desired IP video devices, or select Select All.
3. In the Event Type section, select one type of event or Select All.
4. In the Time section, select a period of time.
5. Select a type of graph.
6. Click Query to display search results.
 Loading...