FAQs: Frequently asked questions (MP85A and PME Assistant)
MP85A A0293_06_E00_03 HBM: public 145
means that about 300,000 measured curves can be stored on one 1GB card.
The card can also be removed during a measurement to read out data.
Do not use high-speed cards. The speed of data transfer is limited by the
device itself. To optimize the access times of the MMC/SD card, you should
defragment or reformat it at regular intervals.
The files are always copied onto the MMC/SD card in the MP85 subdirectory. If
this directory is not yet present, it is generated. Further subdirectories are cre
ated in this directory, if necessary.
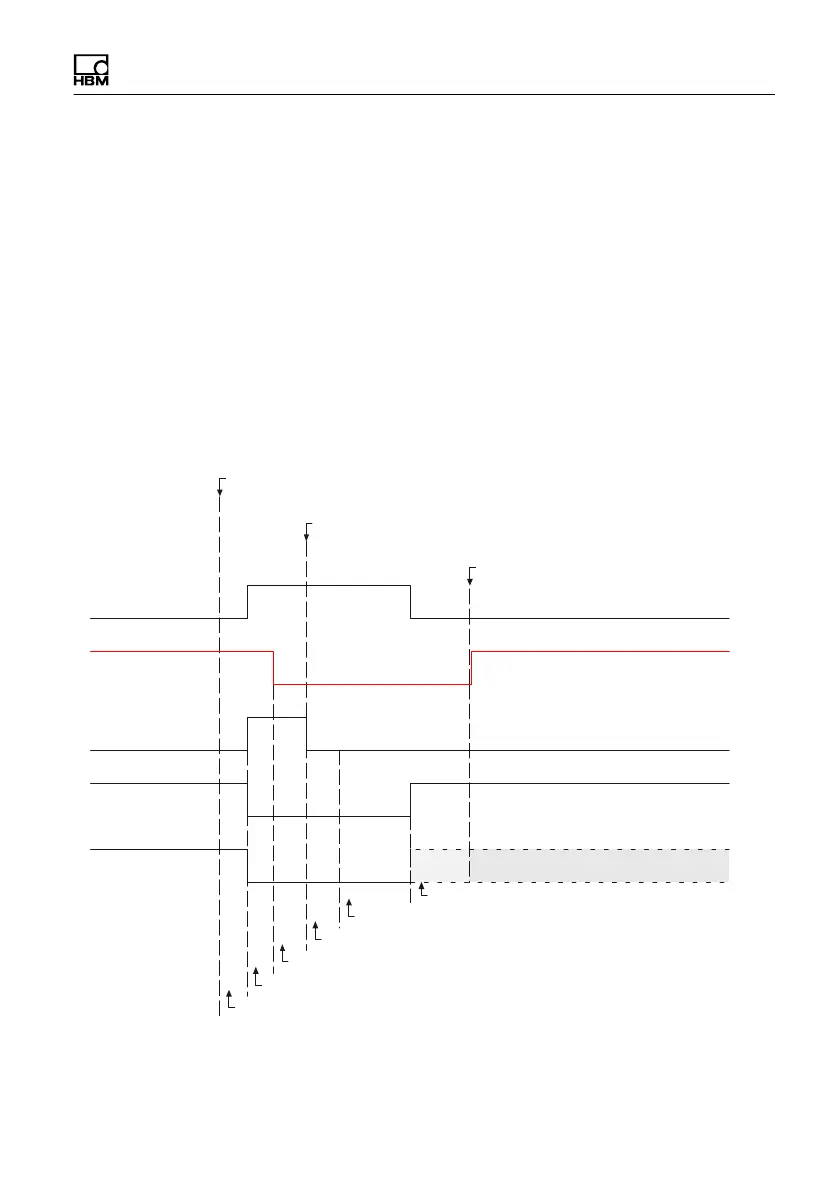
13.21 What does the flow diagram of a process-optimized
measurement look like?
Time until stop (follow-up time, only possible when using
internal stop condition)
Ready
Running
Result valid
Process OK
Save to MMC/PC
Save (to RAM)
Offline evaluation
Measurement
Initialization (typ. 25 ms)
Reaction time (typ. 2 ms for external signal)
Started
Stop (condition fulfilled) or end, if ext.signal for end
condition is used and signal “End” is active
Start (ext. signal "Start"
or condition fulfilled
Signal is only set if end
conditions are fulfilled and
data is saved to RAM
(internal) end condition fulfilled
(with ext. signal ”End” this is
already fulfilled)