Measurement procedure
MP85A A0293_06_E00_03 HBM: public 73
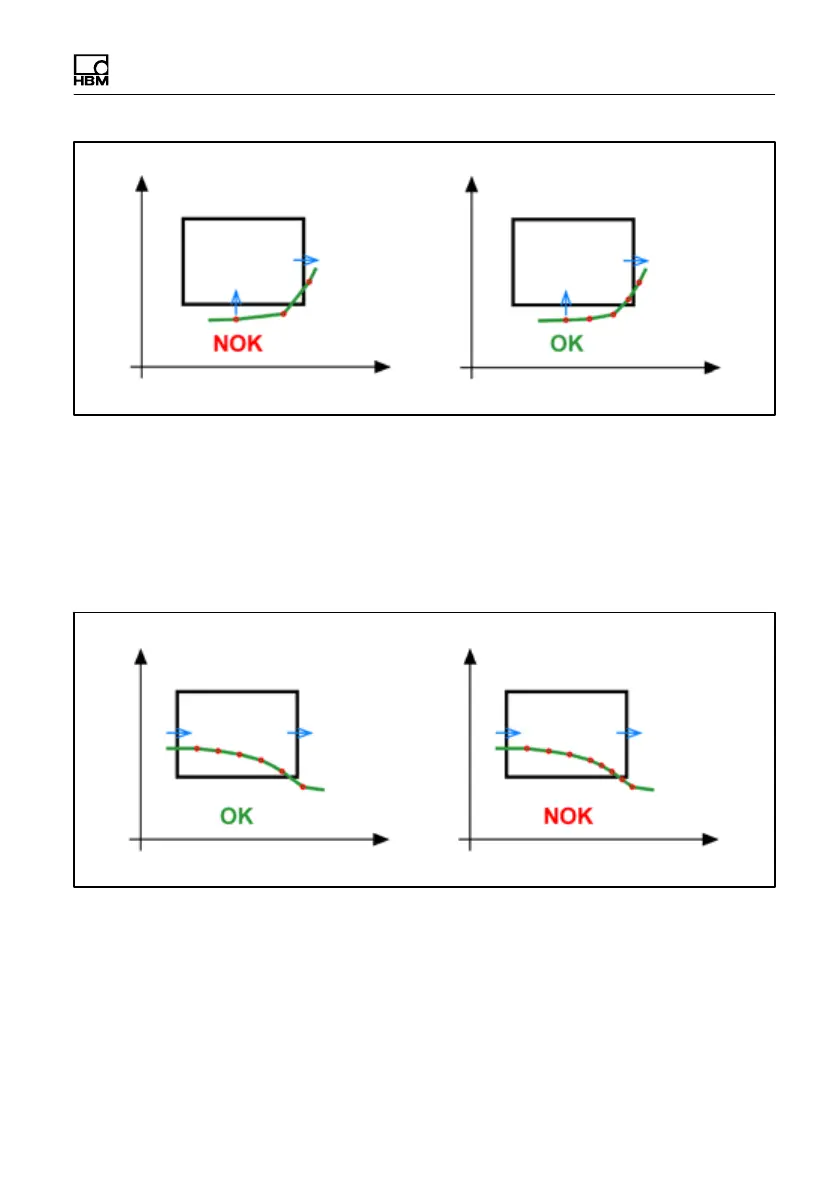
Fig. 8.3 Example of too few measurement points
The graph on the left implies that the result is OK. However, the process is
rated as NOK: As there are no measurement points within the window, there is
no entry or exit and the result is NOK. Increase the number of measured val
ues by reducing nx and/or ny. If at least one measured value then lies within
the window, the result of analysis is OK (right-hand graph).
Fig. 8.4 Example of too few measurement points
The graph on the left implies that the result is NOK. However, the process is
rated as OK: The penultimate plotted measurement point lies within the win
dow (OK). The final plotted measurement point is already to the right outside
the window, therefore the y-coordinate is no longer relevant. The last mea
sured value before this point does lie within the window, however, and is there