Measurement procedure
MP85A A0293_06_E00_03 HBM: public 81
y
x
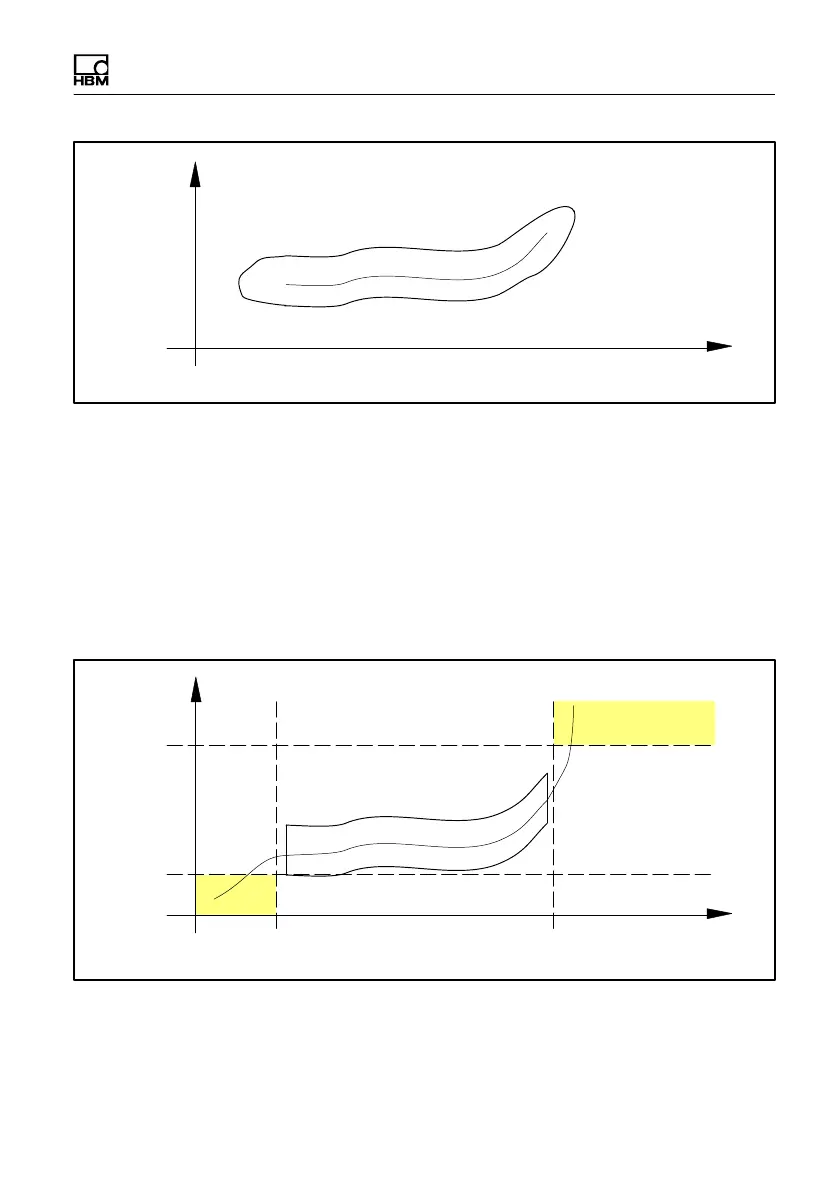
Fig. 8.15 Tolerance band
Limit monitoring
In firmware version 2.22 and higher, the limit values can also be included in the
total result for process monitoring. This allows you to monitor the minimum and
maximum values at the start and end of a process, for example. This option is
particularly helpful for the “envelope curve” and “tolerance band” evaluation
processes: in the diagram below, the start and end of the measured curve are
monitored to check they are inside the area marked yellow.
y
x
LV1
LV1 LV2
LV2
Fig. 8.16 Limit monitoring